Scaling the collection of self-service metrics
March 11, 2015
Almost four years ago, LinkedIn's Site Reliability Engineering (SRE) team began the arduous task of transitioning its metrics gathering infrastructure from a slow, labor-intensive system to the robust metrics pipeline which is still in place today: Autometrics. The self-service nature of Autometrics was a boon to LinkedIn SREs and software engineers alike, allowing for greatly simplified and streamlined instrumentation of both system-level and application-level metrics. Autometrics is now a foundational piece of LinkedIn's infrastructure which is leveraged by many internal tools and applications, either directly or indirectly, to enable many operational tasks -- monitoring, alerting, trend analysis, and capacity planning just to name a few.
Incredible Growth
In the three and a half years since the first Autometrics blog post, LinkedIn has undergone tremendous growth in almost every way imaginable; perhaps our most recognizable external metric is member growth -- from roughly 131 million members to 347 million members at the time of this writing. The infrastructure which powers LinkedIn has undergone similarly impressive growth -- from a single Production data center (with a cold standby) to three live Production data centers housing over an order of magnitude more physical servers. The total number of engineers supporting this infrastructure has grown over 250% in the same period, and over 1,200% within SRE alone.
As a result of all of this incredible growth, Autometrics boasts some impressive numbers of its own:
- From a little over 500,000 metrics collected per minute (roughly 8,800/second) to around 320,000,000 (roughly 5.3 million/second) in Production alone
- From roughly 870GB of used disk space to a little over 530TB
- From an average of 400 metrics per service to an average of roughly 210,000 metrics for the top 500 Production services (per data center)
- From a few thousand metrics-based alerts to over 600,000 in Production alone
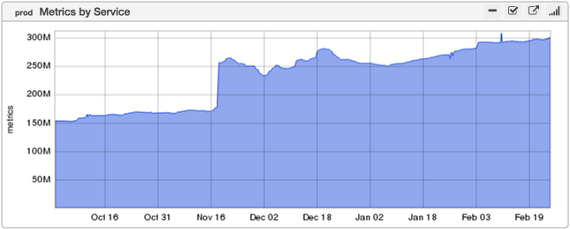 Figure 1: Growth of Metrics since October, 2014; the large spike represents the ingestion of metrics from a new data center
Iterative Scaling and Design
The team responsible for developing and operating Autometrics is also responsible for several other critical infrastructure platforms and services such as metrics visualization, monitoring and alerting systems, remote execution frameworks, and so on. As such, our development resources are typically constrained (as most engineering groups tend to be) and complete redesigns or reimplementations of critical platforms are generally not feasible and are avoided unless technical requirements and/or limitations deem it a necessity. Fortunately in the case of Autometrics, the original design was flexible enough to allow us to redesign the individual underlying components as necessary without requiring service interruption and while being generally transparent to end users.
Replacing NFS
When Autometrics was originally deployed, the primary method of metrics consumption was via inGraphs, our metrics visualization system. The self-service nature of Autometrics combined with the flexibility and customization of inGraphs was a powerful combination as is evidenced by the incredible adoption rate of both systems. The growing number of systems and services generating metrics combined with the increasing number of engineers leveraging the system to create new and useful visualizations quickly pushed the initial implementation of Autometrics to its limits.
inGraphs initially generated graphs from RRDs which had been collected with Zenoss (the monitoring system used by LinkedIn at the time) and served over NFS. When Autometrics came along and replaced Zenoss, NFS remained a natural and easy choice to serve the data to inGraphs since the total number of systems involved was relatively low and performance was generally acceptable. By this time, several services had become dependent upon programmatic access to metrics data exposed through inGraphs' own API.
The reliance upon NFS by Autometrics and inGraphs became more problematic as the number of metrics continued to increase. The number of physical systems involved (all mounted via NFS) grew quickly -- from 4, to 8, to 16, and so on. As the number of moving parts increased, so did complexity; hardware failures in one system almost invariably impacted other systems regardless of the approaches taken to alleviate the issues. Additionally, the disconnect between the source of the data (Autometrics) and the only programmatic access to it (the inGraphs API) became a limiting factor. Since inGraphs used rrdtool to read RRDs over NFS mounts, it was limited to generating data only from locally-hosted systems (i.e. with a single data center). As the number of live Production data centers has grown, so has the demand to generate data aggregated across two, three, or more data centers in a single metric.
We addressed both of these problems with the introduction of a new Autometrics API which eventually replaced the inGraphs API. The new API is composed primarily of four sub-components:
- A small agent which lives on each individual metrics collector responsible for reading its own local RRDs and returning raw data upon request
- A proxy which handles local (i.e. within a single data center) request routing and any necessary coalescing of data into a single response
- A request manager which handles incoming end-user requests, routing requests to proxies (across multiple data centers if necessary), and performing any necessary math (e.g. averaging, aggregating, complex RPNs, etc...) on the resulting data set using pandas
- A REST interface which simply exposes the request manager
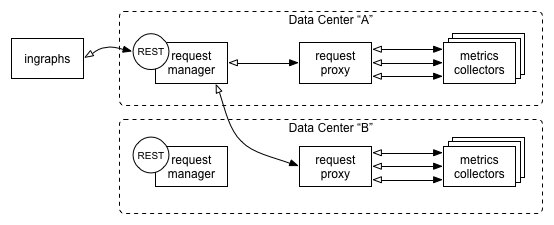 Figure 2: High-level architecture of the Autometrics API showing an example of cross-data center request flow
In addition to greatly improving overall performance and stability, the introduction of the Autometrics API has positioned Autometrics well for future enhancements and flexibility. By abstracting data manipulation and serving away from rrdtool, we'll be able to leverage other (i.e. non-RRD) data sources in the future (more on that later).
With the technical challenges related to munging and serving metrics data at scale well in hand, we turned our attention to a scaling issue of a different type.
Finding a Needle in a Haystack
For a little over a year, the relatively small footprint of Autometrics made discovering and managing metrics a fairly simple and straightforward task. Every inGraphs server had direct access to the filesystems of every Autometrics server; a simple process could easily maintain a map in memcached of every metric location and their latest update times (each of our RRDs are currently written to two separate servers for redundancy, and we serve data from the RRD with the latest update time to ensure data freshness). Additionally, operational support of the system was fairly easy since listing all of the metrics for a particular host or service was as simple as executing a 'find' or 'ls' command. As Autometrics grew, however, these previously simple tasks became burdensome.
The time it took for new metrics to appear in the system was linear in relation the number of total metrics. When there were only a few hundred thousand or even a few million metrics, the time taken for new metrics to appear was still fairly low -- on the order of a couple of minutes. However, as we grew into the tens and then hundreds of millions of metrics, it wasn't uncommon for new metrics to take upwards of 45 minutes to appear in inGraphs.
The sheer number of total metrics and the number of moving parts involved also resulted in a less tangible (though similarly frustrating) side effect. While searching for and discovering metrics was a trivial task early on, by the time we had reached tens of millions of metrics it became a non-trivial if not completely impractical endeavor. Since a large percentage of our metrics are generated automatically by instrumentation within the codebase, it wasn't uncommon to inadvertently generate thousands of new metrics with slight code changes. With no practical tooling to simply list metrics, search for metrics matching a certain naming pattern, or even to get a simple count of metrics across a service or set of hosts, Autometrics essentially became a metrics black box.
This problem indirectly affected the performance of inGraphs as well. With no simple way to reference a group of dynamically-named metrics, we've historically relied on regular expressions to generate dynamic graph dashboards. It's not uncommon for a single graph to reference thousands of metrics (whether the data is aggregated or plotted individually), and with a large percentage of dashboards relying on regular expression matching across hundreds of millions of metric names, overall graph rendering and serving performance deteriorated.
We addressed all of these problems (and then some) by retrofitting Autometrics with a new metrics index based on Elasticsearch and Couchbase. The new metrics index is composed primarily of four sub-components:
- A small agent which lives on each individual metrics collector responsible for periodically discovering and forwarding the names of new and deleted metrics and update times to the index
- A Couchbase layer which handles ingestion of metrics from metric collectors, populates the Elasticsearch index, and caches index query results for a short while
- An Elasticsearch instance which maintains a complete, nearly real-time index of all metrics within a given environment and handles all incoming search queries
- A REST interface which exposes certain index functions to Autometrics, inGraphs, and other systems which leverage metrics data
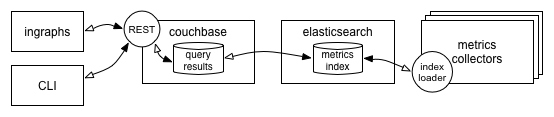 Figure 3: High-level architecture of the Autometrics Index
With the new Elasticsearch-based index, we're able to list and query of any number of metrics across arbitrarily large sets of hosts or services and utilize powerful search capabilities with results returned in milliseconds, as well as make new metrics available to inGraphs in generally under a minute. Additionally, we've built an accompanying command-line tool which enables users to perform a number of operational tasks (e.g. list, search, count, delete, etc...) from anywhere.
What's Next?
Autometrics' RRD-based metrics store has served us well for a number of years. Despite its age, there are plenty of pros to using RRDs: automatic data interpolation, simple consolidation functions, and easily predictable storage footprints just to name a few. However, with an ever-growing footprint and more and more applications leveraging data from Autometrics, the need to redesign the underlying data store itself has become clear. The new data store will address many current limitations, such as:
- Manual replication of data via double reads/writes (resulting in non-trivial data validation and correction mechanisms)
- Rigid bucketing mechanics resulting in non-trivial capacity expansion
- The immediate loss of raw data due to internal time-step windowing
We also lose a fair amount of metadata associated with each metric when writing to disk under the current RRD-centric system as most of this metadata is dumped into an already-overloaded file name making it difficult to parse. The new data store will make use of the newly-redesigned index more seamlessly, indexing all of this useful metadata (e.g. container names, instance numbers, data types, etc...) as soon as a new metric is created. This will enable us to make newly-generated metrics available in inGraphs almost instantly, and will allow us to use a more tag-centric approach when referencing metrics (allowing us to eliminate the use of regular expressions in dashboards, amongst other things).
The flexibility of the new Autometrics API and index will also allow us to seamlessly leverage other data sources in the future, building graphs from data stored in other systems. While our new data store will solve our time series data requirements, there are operational use cases for supporting graphs based on multi-dimensional data, which LinkedIn's Pinot would be ideal for.
The iterative approach to scaling and design that we've taken with Autometrics has proven to be extremely flexible and has positioned us well for the future. As Autometrics continues to grow and evolve, there will undoubtedly be new feature requests and use cases to leverage its wealth of metrics data which we've yet to consider; with this iterative approach, we're confident that we can successfully meet those challenges as they're presented.