Optimizing Java CMS garbage collections, its difficulties, and using JTune as a solution
April 9, 2015
Introduction
Let's say you are running Java in a production environment, and one of the instances that plays a critical role fell out of SLA. What do you do? Java tuning has a history of shotgun-approach techniques to recover the service, but what if you had a tool that could:
- Tell you what the JVM is doing in real time over console
- Tell you with high precision what you need to do to fix the poorly running JVM, and have it run more efficiently afterwards
If this sounds good, read on!
Some Background
Like many other companies, LinkedIn has a large Java presence. Like other websites built on Service Oriented Architecture and Microservices principles, the call graph for many of our app and web page requests can be fairly complex and any degradation in call times for downstream services can have detrimental effects. Given this, we take JVM tuning very seriously, and we have several tools that help us catch problems, and provide helpful recommendations.
One such tool that was written in house is called Autotune. Autotune runs both via our automated performance testing service (called EKG), and via the command line for ad-hoc purposes. It looks at many factors, including service GC logs for worst-case conditions (frequent FullGCs for example), and provides recommendations to reduce or eliminate these problem areas. While Autotune helps with worse-case scenarios, the JVM still has many 'knobs' that can be adjusted to squeeze even more out of a JVM. In LinkedIn's business, every millisecond counts, and this is where JTune comes in to play.
If I were to count the number of articles and blog posts that discussed tuning JVMs (specifically CMS), I would probably run out of numbers. Most of the ones that I've seen are observational, for example "increasing the heap size will decrease the frequency of FullGCs". This is all well and good, but how do all these observations interact with each other into the running of the JVM? While you can get some of the way there by looking at the GC logs, it's nearly impossible to get to the 'long-tail' part of optimization without a tool to help you out. In this article, I'll explain why it's difficult, and provide a solution to make it all fairly straightforward.
More is better, right?
Traditionally, the quickest way to get a JVM running again after poor performance is adding memory to the heap. Poor performance frequently is the result of the JVM not having enough memory, or poor partition sizing (Eden, Survivor, and OldGen), and spending too much time trying to find free space to keep the application running. By adding memory, you're giving the JVM a bigger work area to do its job, and lo-and-behold, the JVM doesn't crash. Problem solved! The downside is that while your JVM isn't blowing up, it's highly probable that it's still not running as well as it could. The basis for all of JTune's suggestions follow three basic tenets:
- The aggregate time spent doing GCs over a given sample period is a more important metric than the frequency of GCs.
- To provide consistent results to our customers (in Search, our customers are the myriad services that call us), the standard deviation of the GCs should small, consistent, and predictable.
- More is not always better.
For #1, which is better: a single GC pause that takes anywhere from 70-90ms every 60 seconds, or 4 17-19ms pauses over the same interval? There are of course always exceptions, for example the frequency of GCs can be bad if you're using the JVM as a batch processor. The reason for this is if all the batch jobs can finish before a JVM has to do a GC, then optimizing for a large working area would be better. JTune is more tailored (although it's command-line configurable) to application servers that serve client requests in a predictable pattern.
While most of the time GCs are non-blocking, doing any GC work does take CPU cycles away from the running process. For question #1 above, the GC activity is happening more frequently, but the total time spent doing GCs is less, AND the standard deviation is smaller, too. The standard deviation leads us to our second tenet. Standard deviation is a metric of variance - the more change there is in a number sequence, the larger the standard deviation. Conversely the less variance in a number sequence, the smaller the standard deviation. For the Search team, we want predictable behavior for our services so our customers get consistent results in a predictable amount of time rather than periodically getting poor performance. Calculating standard deviation of our GCs is a key component of that. This brings us to our last tenet of "more is not always better". If we revisit the first question, when we increase heap, it usually leads to less frequent, and longer GCs. The opposite is also true - decreasing the heap leads to more frequent, and shorter GCs. These two dependent variables (frequency and length) can be amalgamated into a single metric: "aggregate time" which is a much more useful statistic, and gives you a much better idea of how hard the JVM is working.
The Analytics
To really know what is going on with the JVM, you have to ultimately look at the GC logs. Just using jstat for example is not enough. The GC logs contain a wealth of information (assuming you have -XX:+PrintTenuringDistribution, and -XX:+PrintGCDetails enabled in your JVM config), and for someone to manually analyze the GC logs, it is nearly impossible to do it accurately/correctly. The reason it's difficult is that a critical piece of JVM performance tuning - how objects are tenuring - requires one to track the changes across log entries for each interleaved survivor age, and the time between those log entries. That's a lot of math.
So, let's take a look at what JTune does. When you run JTune, it captures the output of jstat, reorganizes it, and displays the output to the screen. This allows the engineer to see what the JVM is doing in real-time. Here's what running jstat on one of our Java instances looks like:
The data is there, but not in a very useful format. Here's how it looks when you run JTune on the same Java instance (with additional percentage-used 'EP' (Eden Used Percentage), and 'OP' (OldGen Used Percentage) fields):
Looks much better, and a lot more useful. The columns are reorganized from left to right to reflect the life-cycle of the objects from Eden to the Survivors to Old Gen, and numbers are rounded to their respective IEC units (MiB, GiB, etc.). After hitting CTRL+C (or by a command-line option), JTune fseeks back in the GC log , and gathers additional information to make its recommendations.
Before I continue, I want to pause for a moment. There seems to be a general feeling that one can not tune a JVM if it's running poorly. Why? If the JVM is poorly configured/unoptimized, how can one determine what the application's peak load is, and if we don't know that, then how can we tune? Very logical, but I like to think of the JVM as a cook in a kitchen with a small counter space. When the space is clear, you have a pretty good indicator of how fast the cook can work, but once the counter is cluttered, it's much harder. JTune looks at these fleeting periods, and can use that information to extrapolate what it'd do in a more tuned scenario. Here's a somewhat complete list of what JTune gathers while it runs:
- YoungGen (Eden) allocation rates (aka the application bandwidth). This metric is a good indicator of how much work the application is doing by watching the allocation rates of objects the application is creating.
- OldGen growth/promotion rates. This is how fast objects are being dumped into OldGen after moving through the survivor space.
- Survivor death rates. This is the death rate (as a percentage) of objects in the survivor space that are still alive right before it makes it to OldGen. This is the most important piece because it tells you very accurately how your objects are aging which I essentially call the 'fingerprint' (or the "object life-cycle" in fancier terms) of the application.
- CMS sweep times. This is the amount of time that the JVM takes to comb through the objects in OldGen to see what is no longer being referenced.
- YoungGen times. This is how long the JVM spends doing a YoungGen.
- FullGC times.
The JVM does memory management (GCs, object tenuring, etc.) when a trigger happens, and this trigger is when the Eden space is filled. I like to refer to the Eden space as 'survivor age 0' (because that's really what it is), and the trigger I call a 'tick' (like a clock). If we know what our YG (Eden) allocation rates are, we can safely control the frequency of the tick by changing the Eden size. For example, if a 400MiB Eden fills in 1 second, a 200MiB Eden will fill up in 500ms. If we shrink the size of the Eden space, that will affect the Survivor aging as the ticks will happen more frequently causing objects to be tenured into OldGen much faster. To counter this, we need to increase the max survivor age with the -XX:MaxTenuringThreshold and -XX:SurvivorRatio values appropriately. You can see that it gets complicated pretty quickly, but can all be determined accurately in JTune.
When a CMS runs (when the occupancy percentage is greater than the default 90%, or from the -XX:CMSInitiatingOccupancyFraction value), or when a FullGC runs (when an object can't be tenured into OldGen due to fragmentation or no space), you want it to be as productive and happen as infrequently as possible. Most applications have long-lived objects, and the OldGen space will reflect this. What you don't want is your -XX:CMSInitiatingOccupancyFraction set near the working-set size of OldGen (the working-set size is the size of OldGen after a CMS/FullGC happens). But what should it be set to? JTune can find out this ideal value by seeing how fast OG fills up, and how long it takes it to find and reap unreferenced objects. For example, if it takes 5.455 seconds (max time over the JTune run) to scan and reap a 606 MiB OG, and the OG growth rate is 34.73 MiB/s (99th percentile), we can use the following formula to come up with a OccupancyFraction of 69%:
This formula is a simplification of what JTune does, but gives you a general idea of the method.
End Results
I think pictures provides the best illustration of how well JTune is able to squeeze much more out of a JVM. The first test case was against one of our data stores:
- This one shows the CPU utilization for a single JVM (a ~75% reduction):
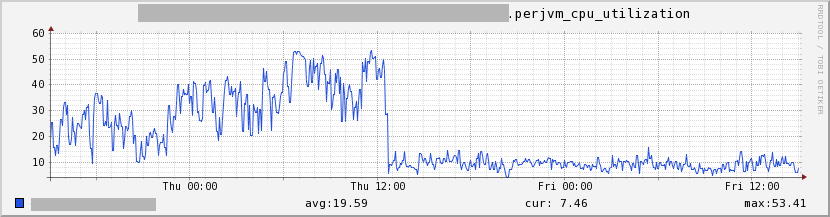 Figure 1: Per JVM CPU Utilization
 - This one shows the stall time caused by GCs (a ~44% reduction):
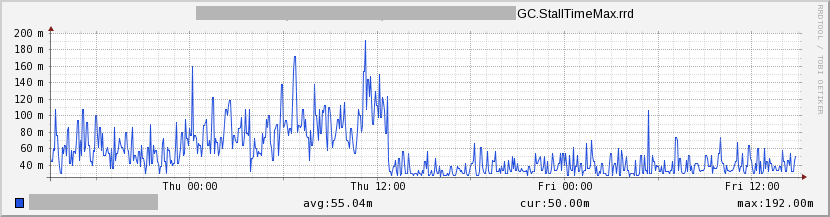 Figure 2: GC Stall Time
 - The last one is the number of CMSs happening. There simply wasn't any CMSs happening after it was tuned (can't get better than this!):
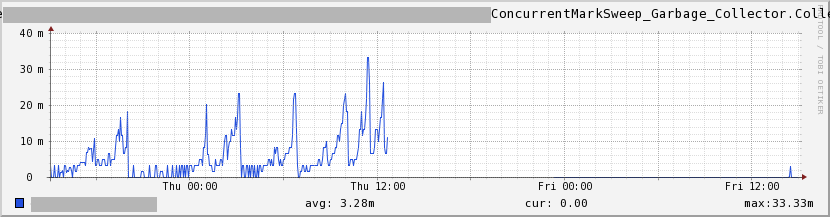 Figure 3: CMS Counts
And, this is one of our newer services for Search:
- This is the time the service spent doing GCs (a ~62% drop):
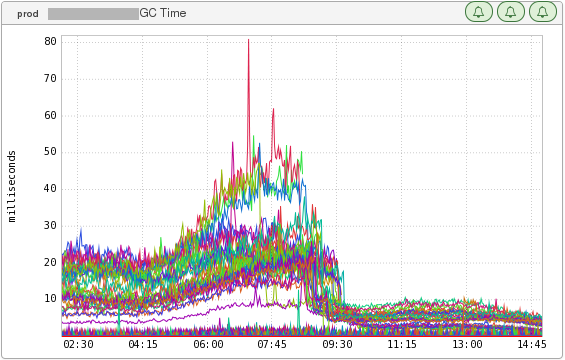 Figure 4: GC Time
 - This is of the same service showing the GC count (a ~81% drop):
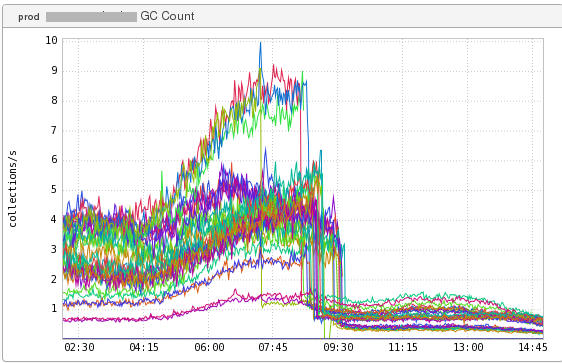 Figure 5: GC Counts
What's next?
JTune is open sourced. If you'd like to learn more, you can download the tool at our LinkedIn GitHub repository at https://github.com/linkedin/jtune. It includes a README.md file that explains how to use the tool more. If there is an interest, I can go into more detail about the calculus behind what JTune does, and/or why we're still using CMS instead of G1 for many of our services. Thank you for reading!