Rewinder: Interactive Analysis of Hadoop's Computational Resources
September 23, 2015
 Teja Thotapalli |  Brian Jue |  Tu Tran |  Sandhya Ramu |
As LinkedIn continues to grow in size and stature, the data volume being generated continues to increase at an exponential rate. In order to gain insights from the massive amounts of structured and unstructured data at LinkedIn, we leverage the Hadoop framework, which has the power to store and process all kinds of large datasets. Hadoop's multi-tenancy architecture allows us to address the challenges of a shared storage/compute environment and maintain resource provisioning and service level guarantees for tenants.
One of the responsibilities of our Hadoop Application Operations team is to monitor and maintain the bulk the of the data on grid, including many of the business engagement workflows that consume the datasets. It's a precarious balance between ensuring that the data is generated and propagated across the grid clusters while also adhering to the dataset consumption timings of the user. Keeping track of each individual job, their immediate and overall resource utilization, coupled with the potential contention hurdles they may face, can be a daunting task. This blog post explains why we needed to create a tool that could help us better manage the operational aspects of our Hadoop application.
The Problem: Too Many Flows, Not Enough Insights
As an operational team supporting many flows and jobs running on the Hadoop cluster, we often felt the need for insights into how resources were being allocated. These insights will help analyze the behavior of the job. For example, if the cluster is busy for one hour, that can be attributed to a job's long run time.
Currently, the ResourceManager and Job History Server are the only two venues that provide visibility into resource utilization and they each have limitations. The ResourceManager can only show the resource utilization of the cluster at present time, not in recent past. Job History Server provides information about the resource ask by that application but for only MapReduce jobs. While this information is necessary in understanding how things unfolded, it can be a tedious task to stitch together different job activities and their associated allocation of resources to provide a holistic view of resource utilization.
Our Solution: Rewinder

In order to help assuage the operational aspect of the Hadoop applications running on the grid clusters, we developed Rewinder, named for the ability to allow us to go back any minute in time. As a method to garner insights into the resource utilization, Rewinder sifts through the sea of application data and surfaces the reasons behind how the computation resources are utilized and how they may affect job processing.
Rewinder collects raw information about how the memory and vCore resources are being utilized in a grid cluster using a rich set of YARN Rest APIs. This raw information is aggregated to give visibility at varying granularities, namely the entire cluster, queue and user.
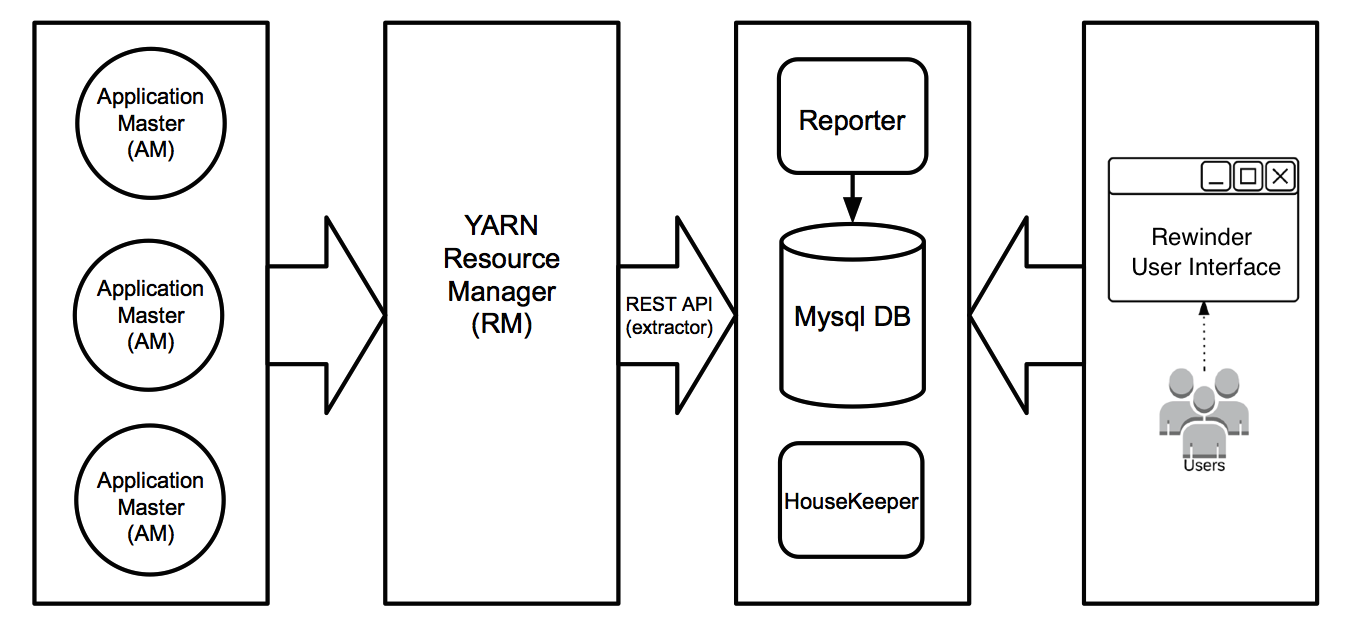
The Rewinder tool is comprised of four components :
- Extractor : A high frequency job that runs every minute and uses the YARN Rest API to get the raw data, which is essentially the resource utilization of each running Application Master. This also does some basic aggregation.
- Reporter : A nightly job that feeds on the existing raw data and generates reports with the desired the insights.
- Housekeeper : A nightly job that runs the basic housekeeping activities like purging old data and creating new table partitions.
- Trigger : The actual driver program that uses Java Quartz Scheduler to maps out all the above components.
As of now, all the data is stored in a MySQL DB. Currently for our dev cluster data is 14GB and stores 70 days worth of data. We are adding on average 600 thousand records (2GB) of data to the database every day.
One of the challenges we were facing was determining how much memory was being consumed by an application. Every minute, Rewinder captures the resource allocation for each application and calculates its consumption rate, denoted both in megabytes per minute and in the number of vCores per minute.
It's important to note that the API does not expose the actual resource consumption, rather it shows the allocated resources from the entire pool. Once allocated, they cannot be claimed by anyone else until it flows back to pool, consequently, we collect this information at the lowest grain (Application Master) that can be rolled up to multiple levels to gain insights.
Here are a few examples of Rewinder's capabilities :
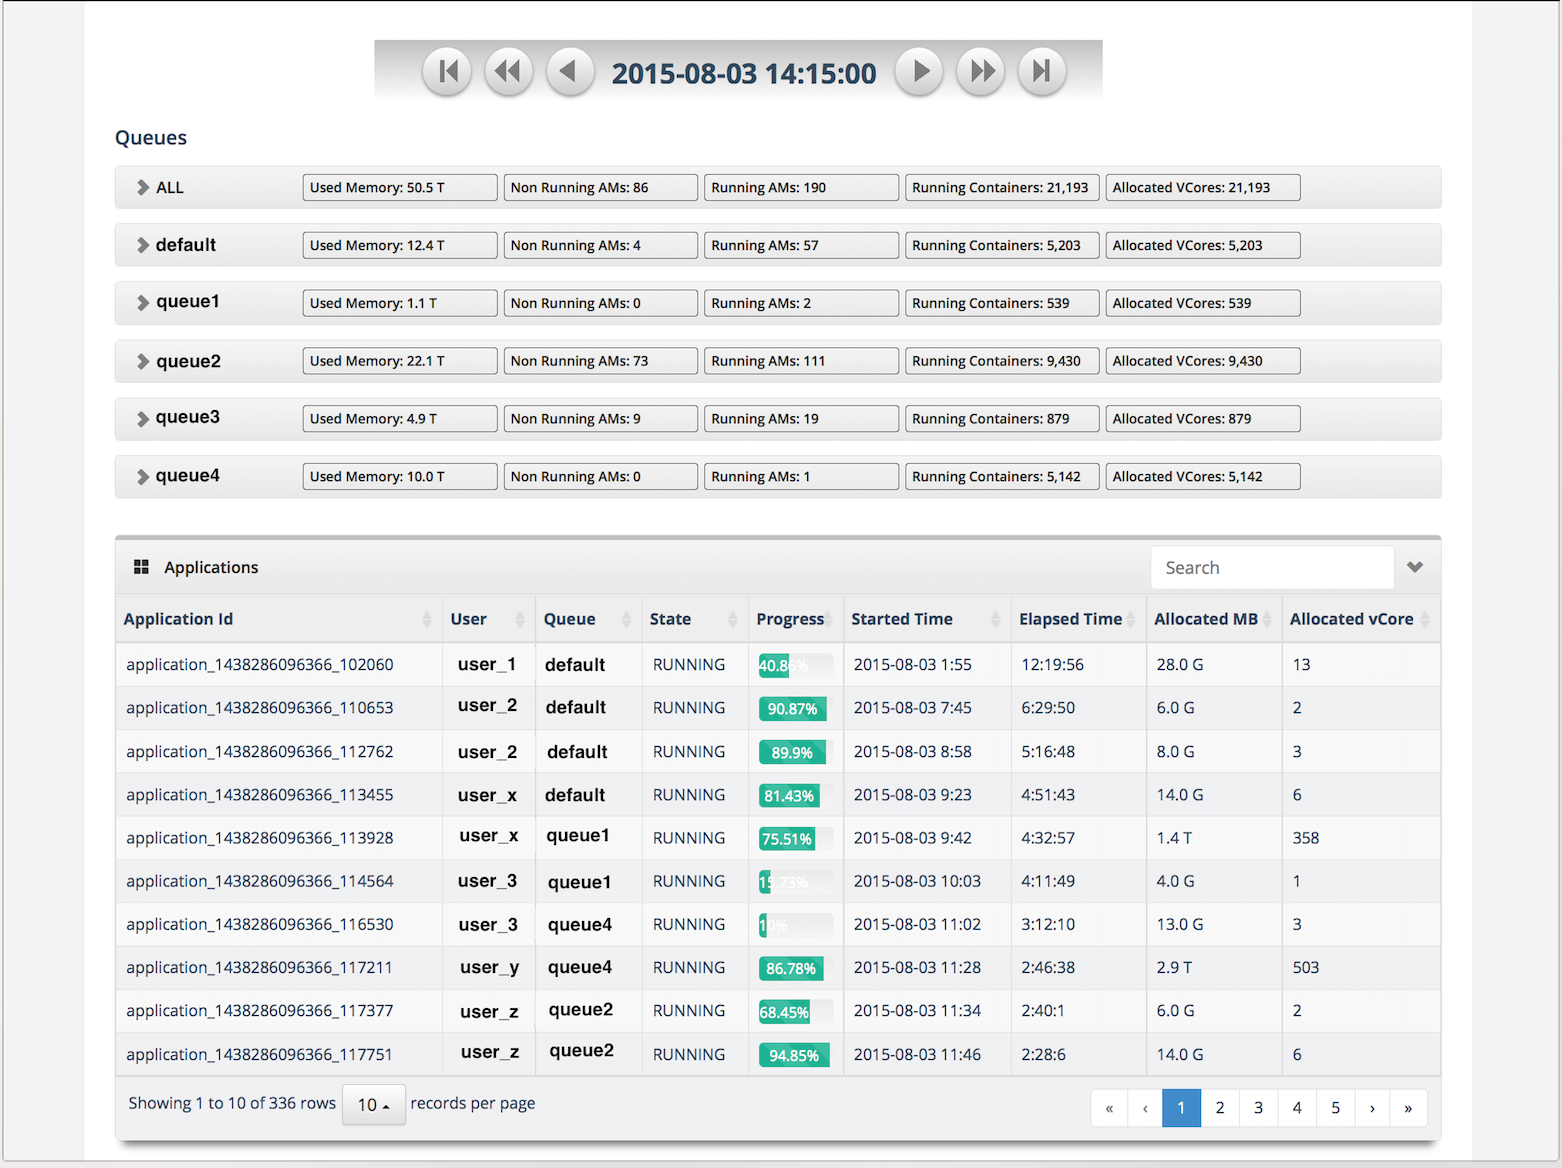
- You can easily go to any minute in a day, and see what jobs are running and how the resources are being shared among multiple applications, user and queue.
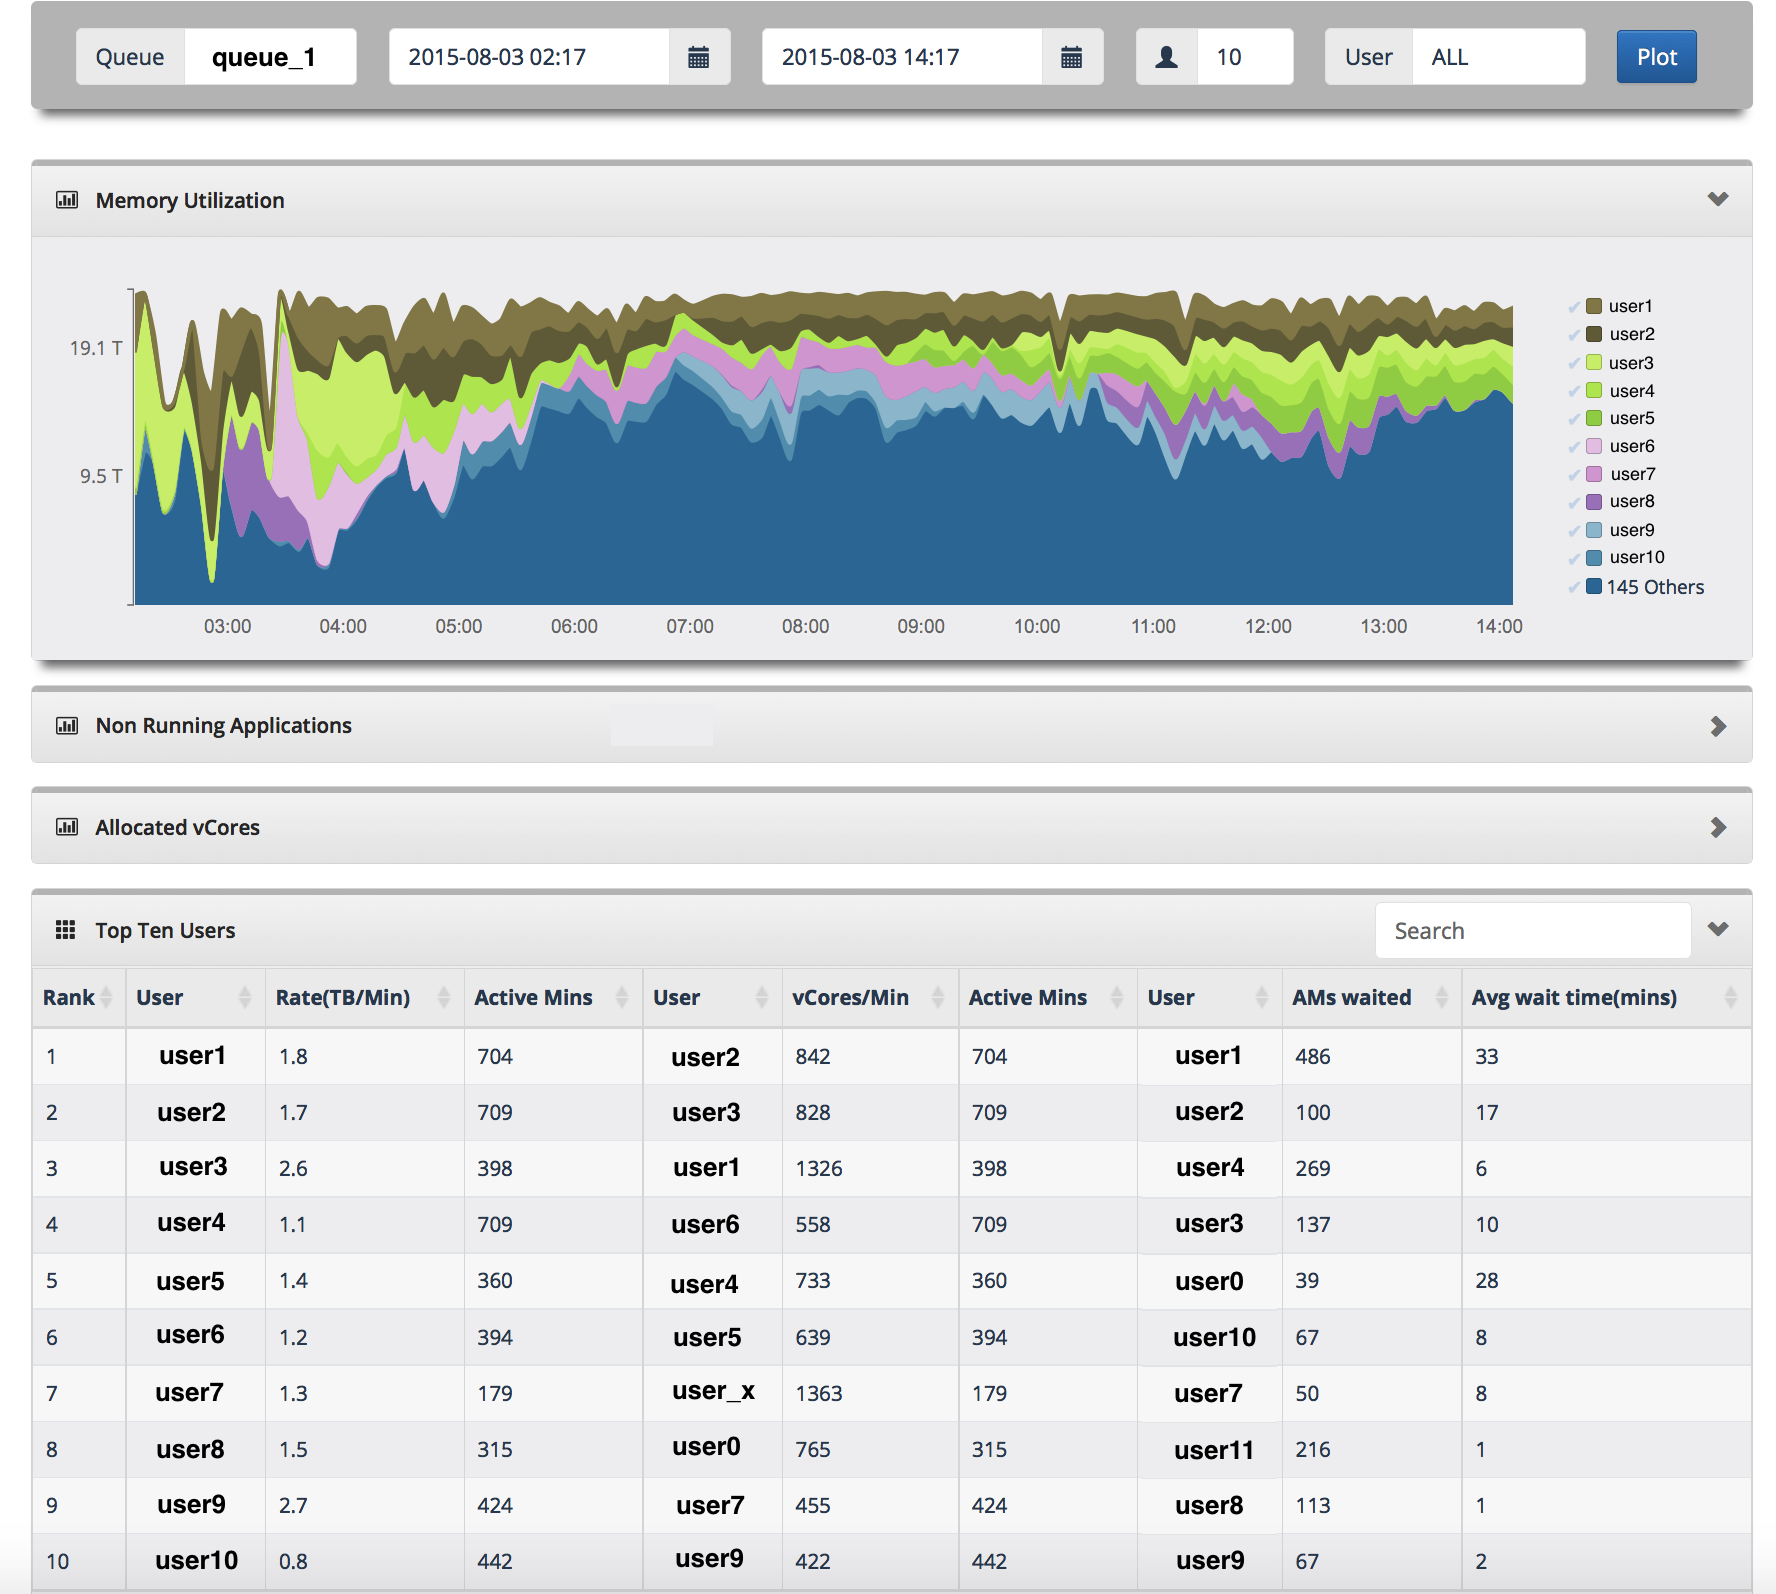
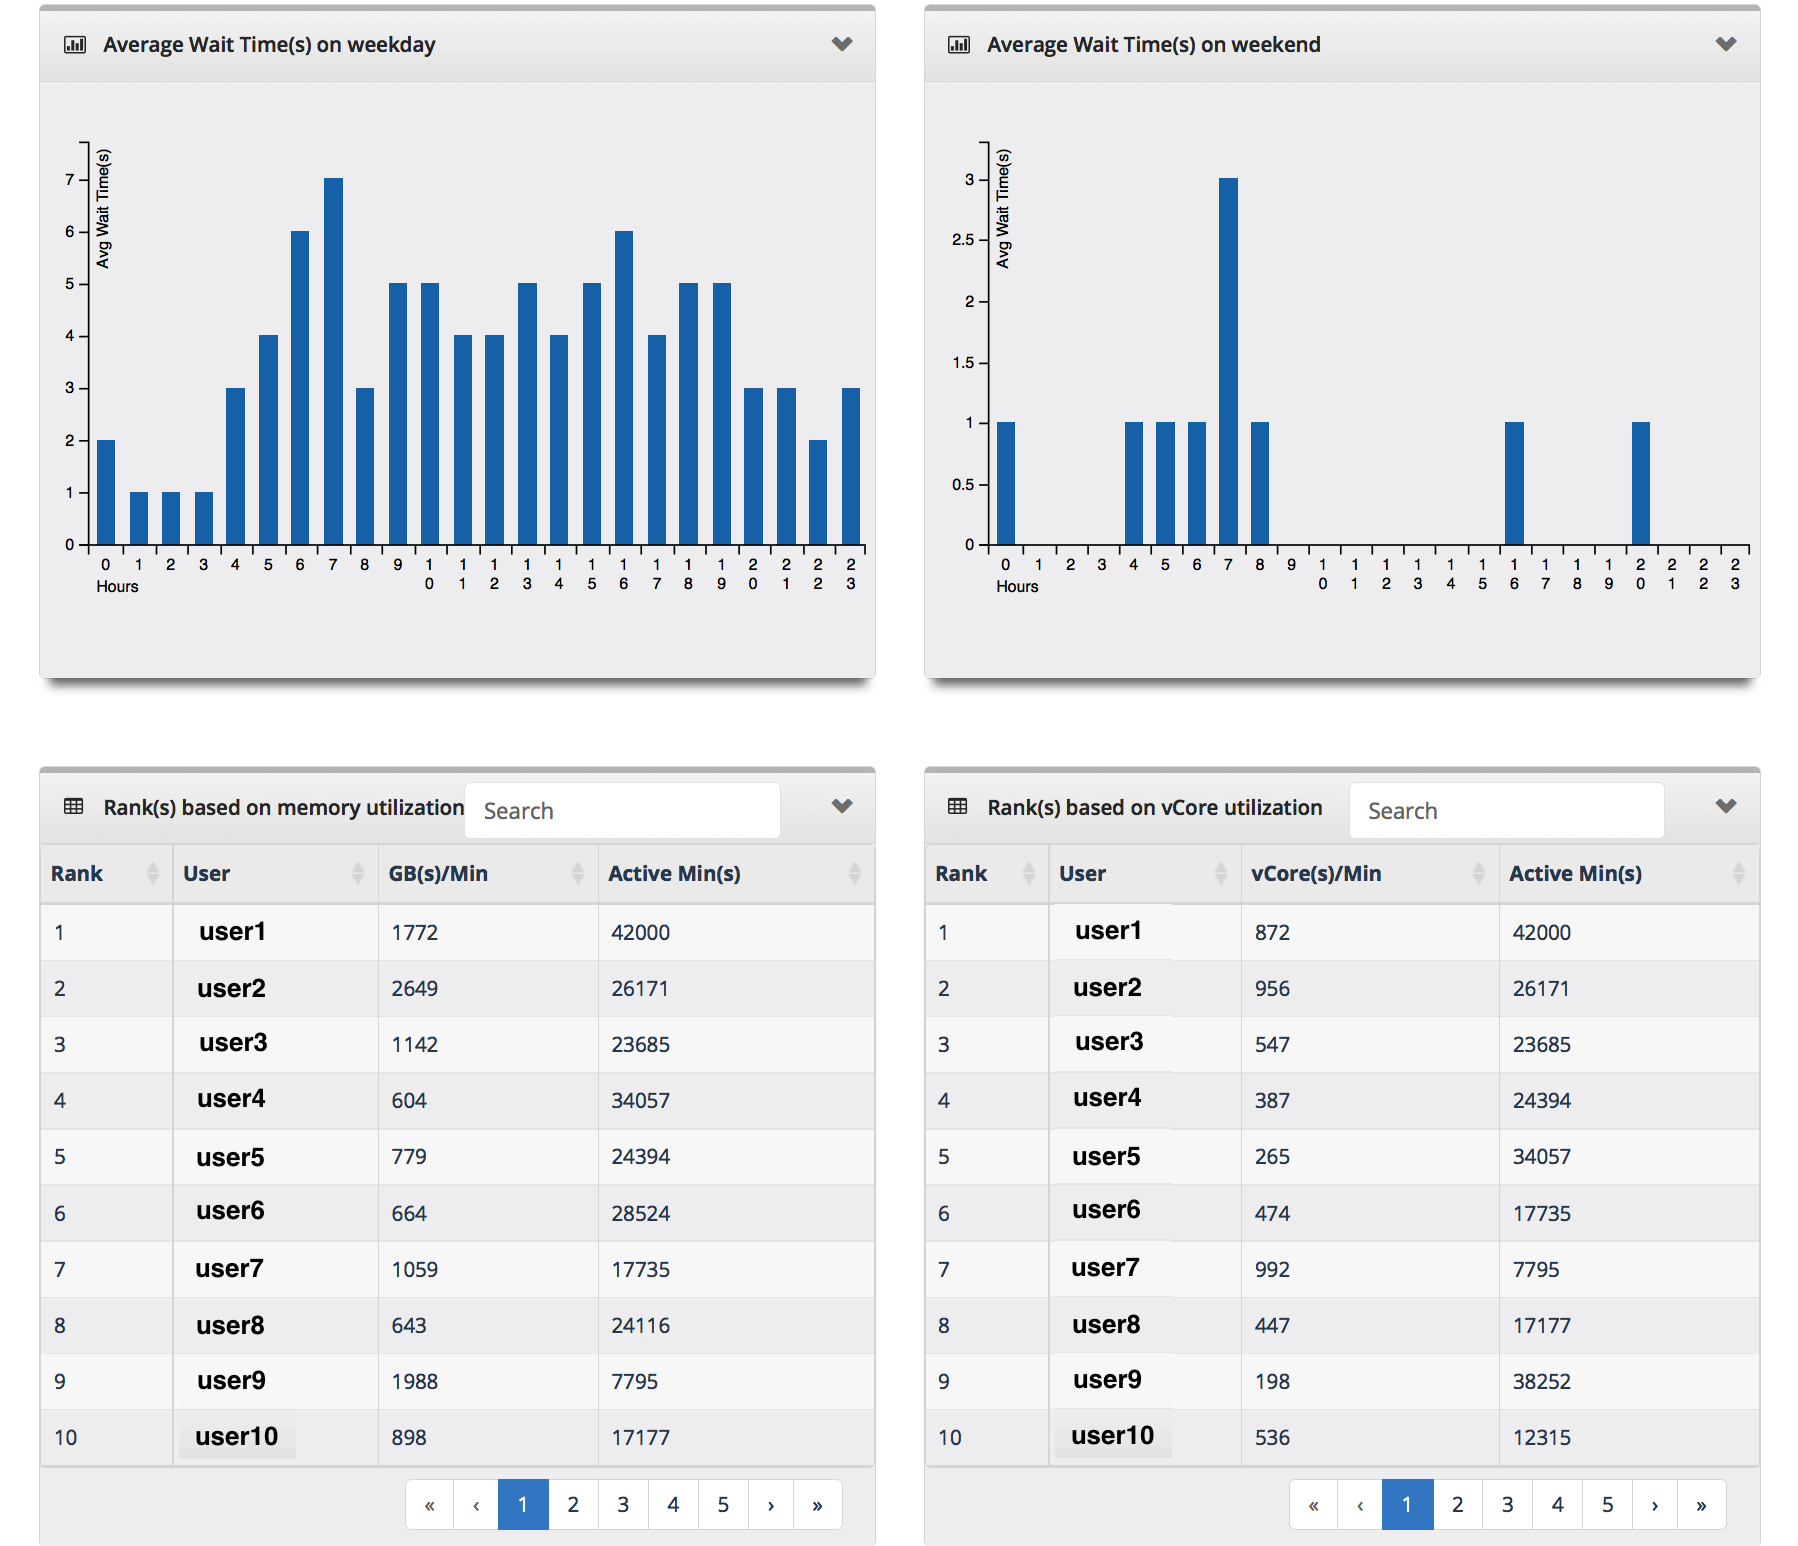
- For any given time frame, you can see how the resources are shared among users in a queue. This bubbles up the top resource consuming users. This also let us do a given user vs. rest of the world comparison. You can also see how many applications are in waiting state and the top ten resource consumers.
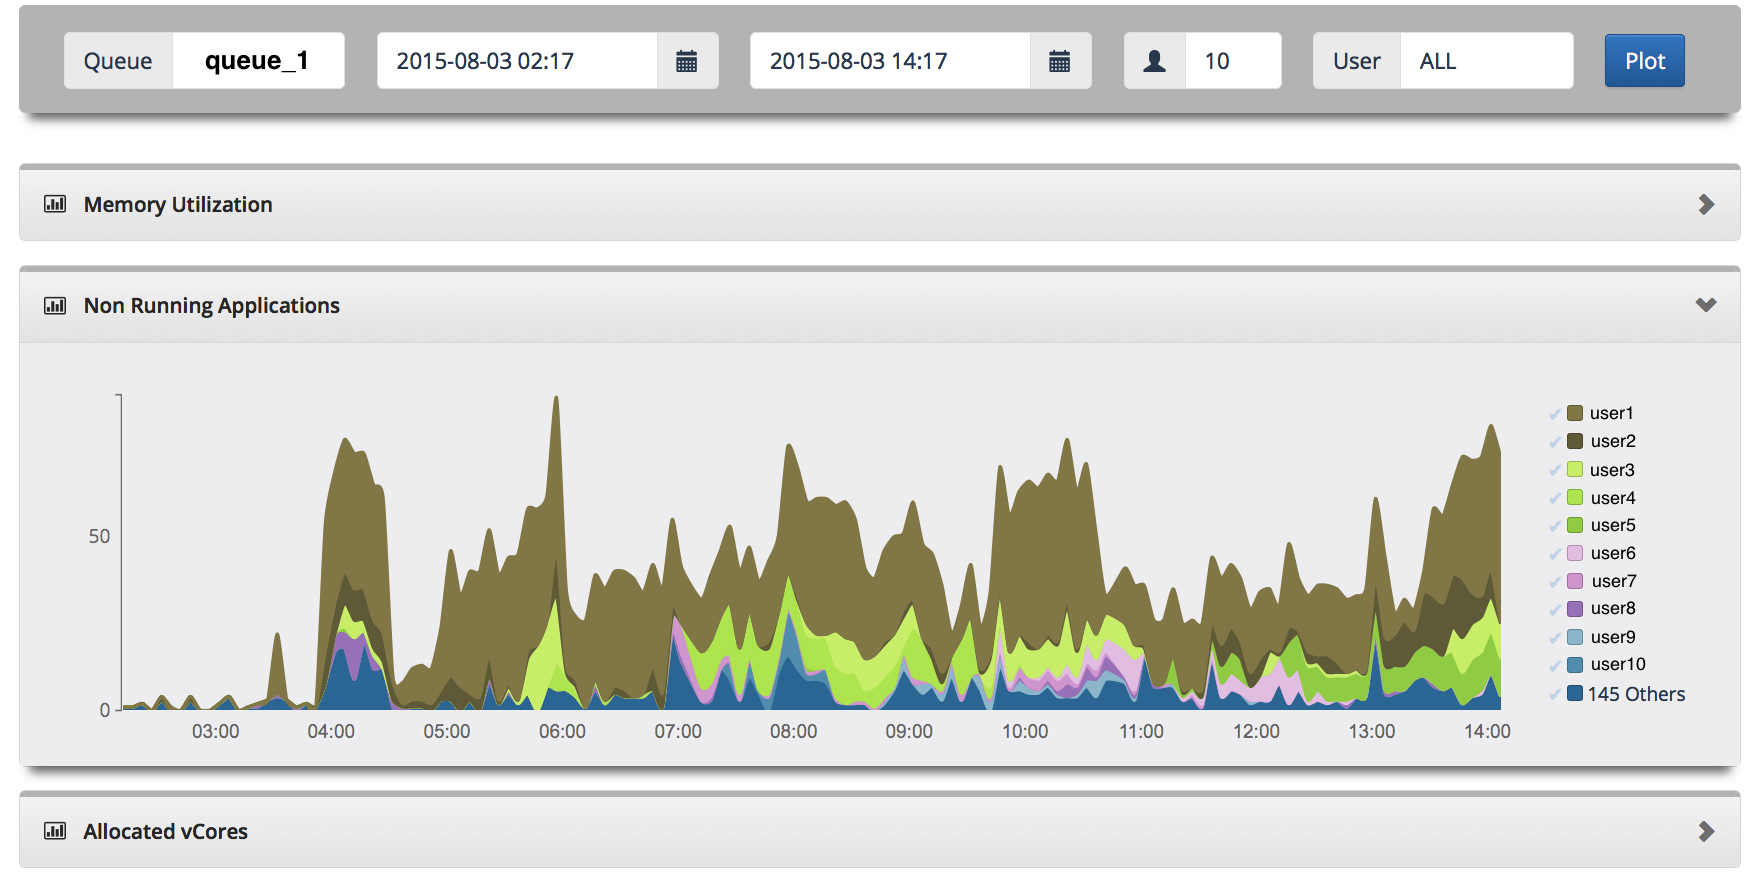
- Rewinder provides insight into how applications waiting for resources are piling up.
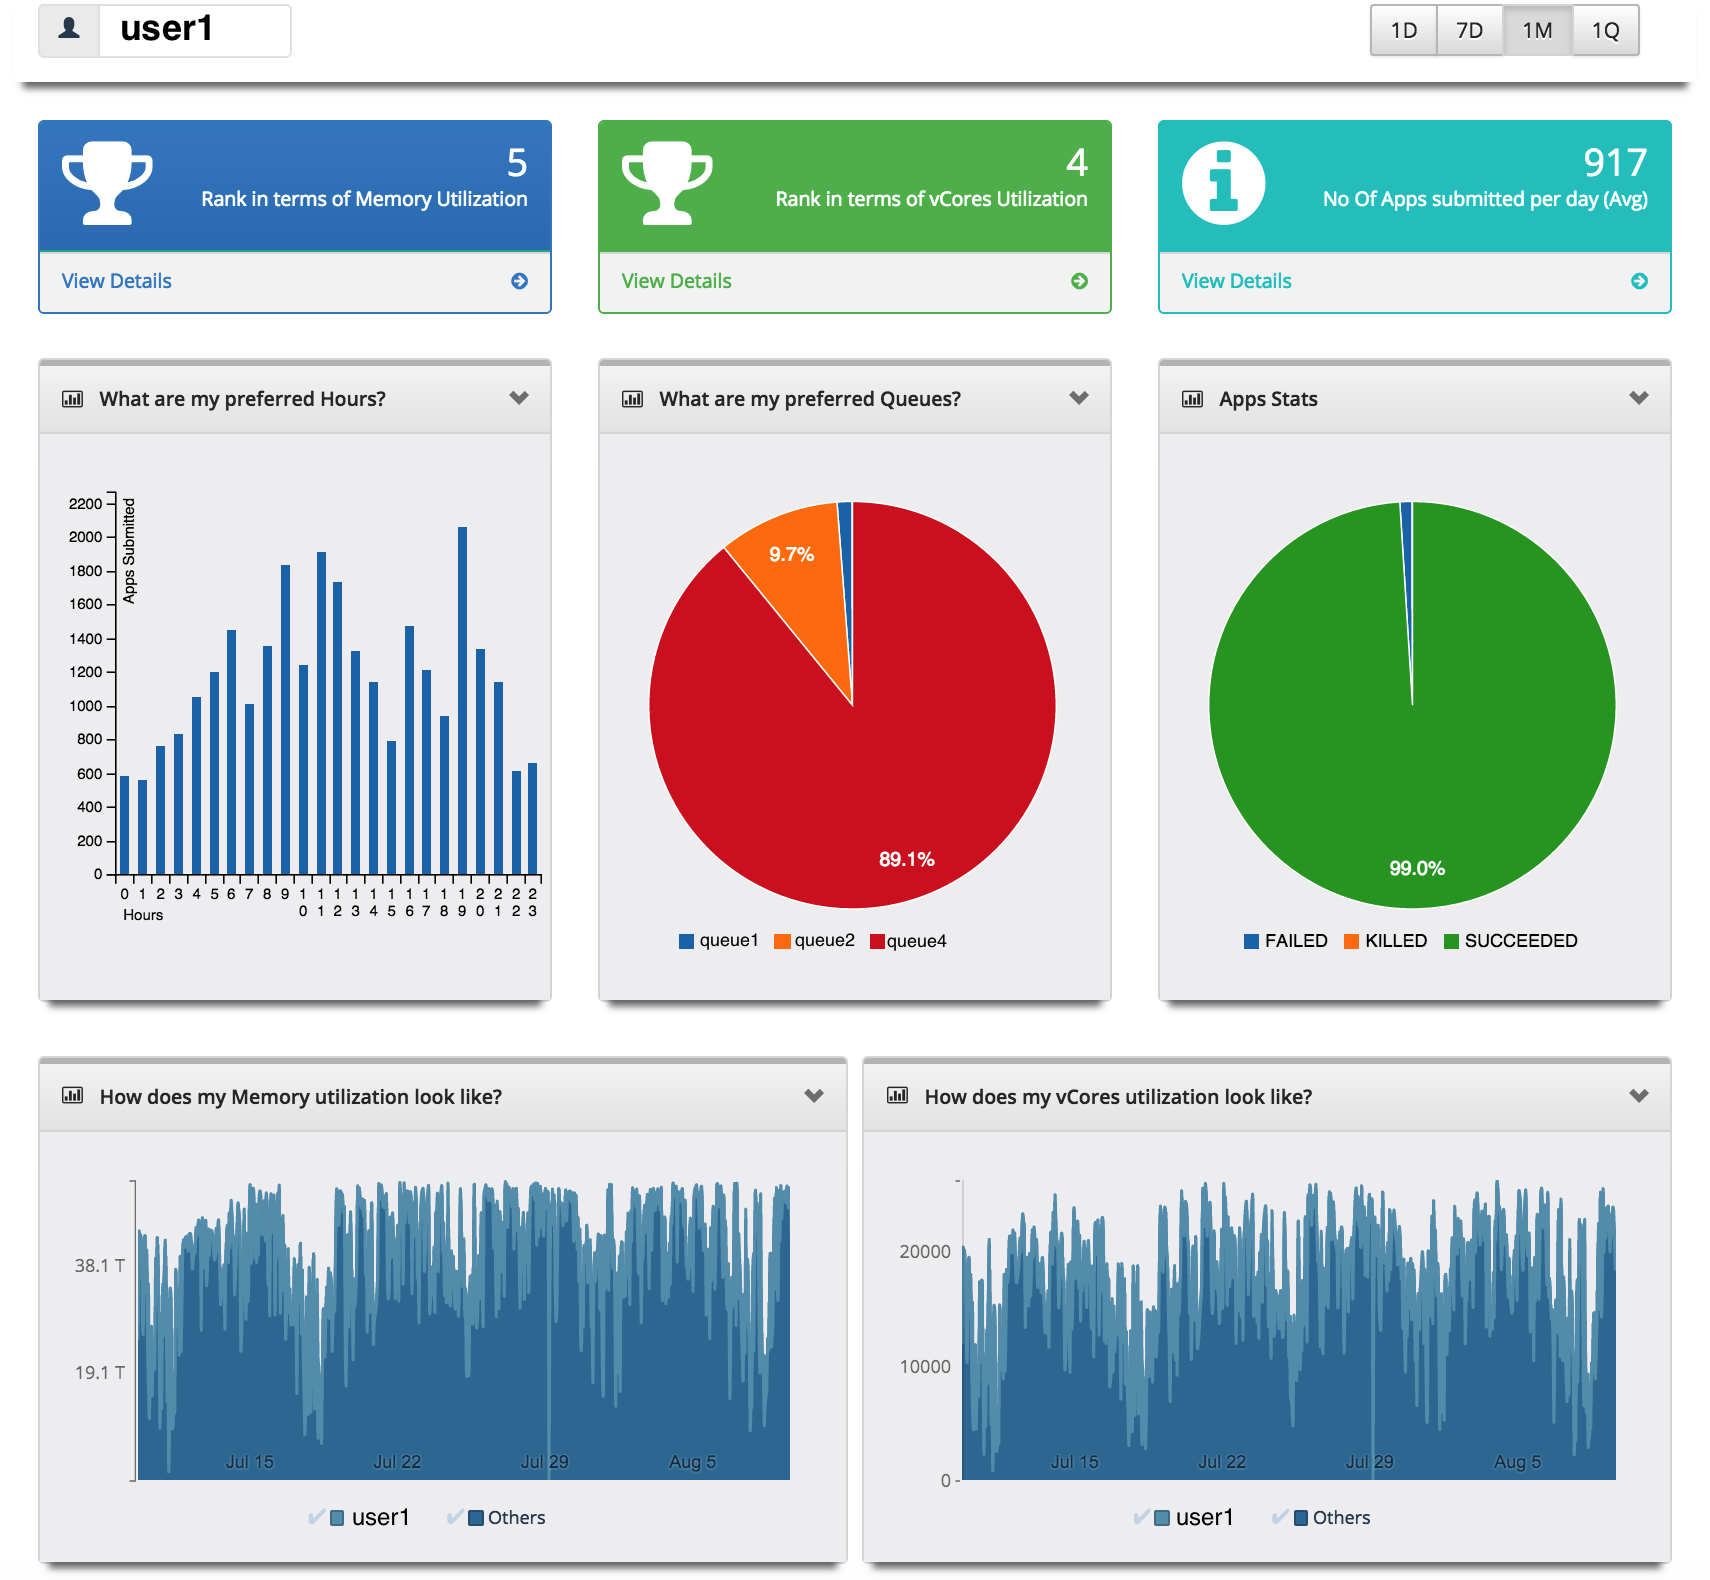
- The tool also generates reports on resource utilization per user, answering questions like :
- What does resource utilization look like over the past 30 days?
- Where does the user rank in resource utilization?
- How many applications does that user submit every day?
- What is the average wait time and run time of applications?
- What time and which queues does the user submit most of his jobs?
- What are the top resource-consuming jobs?
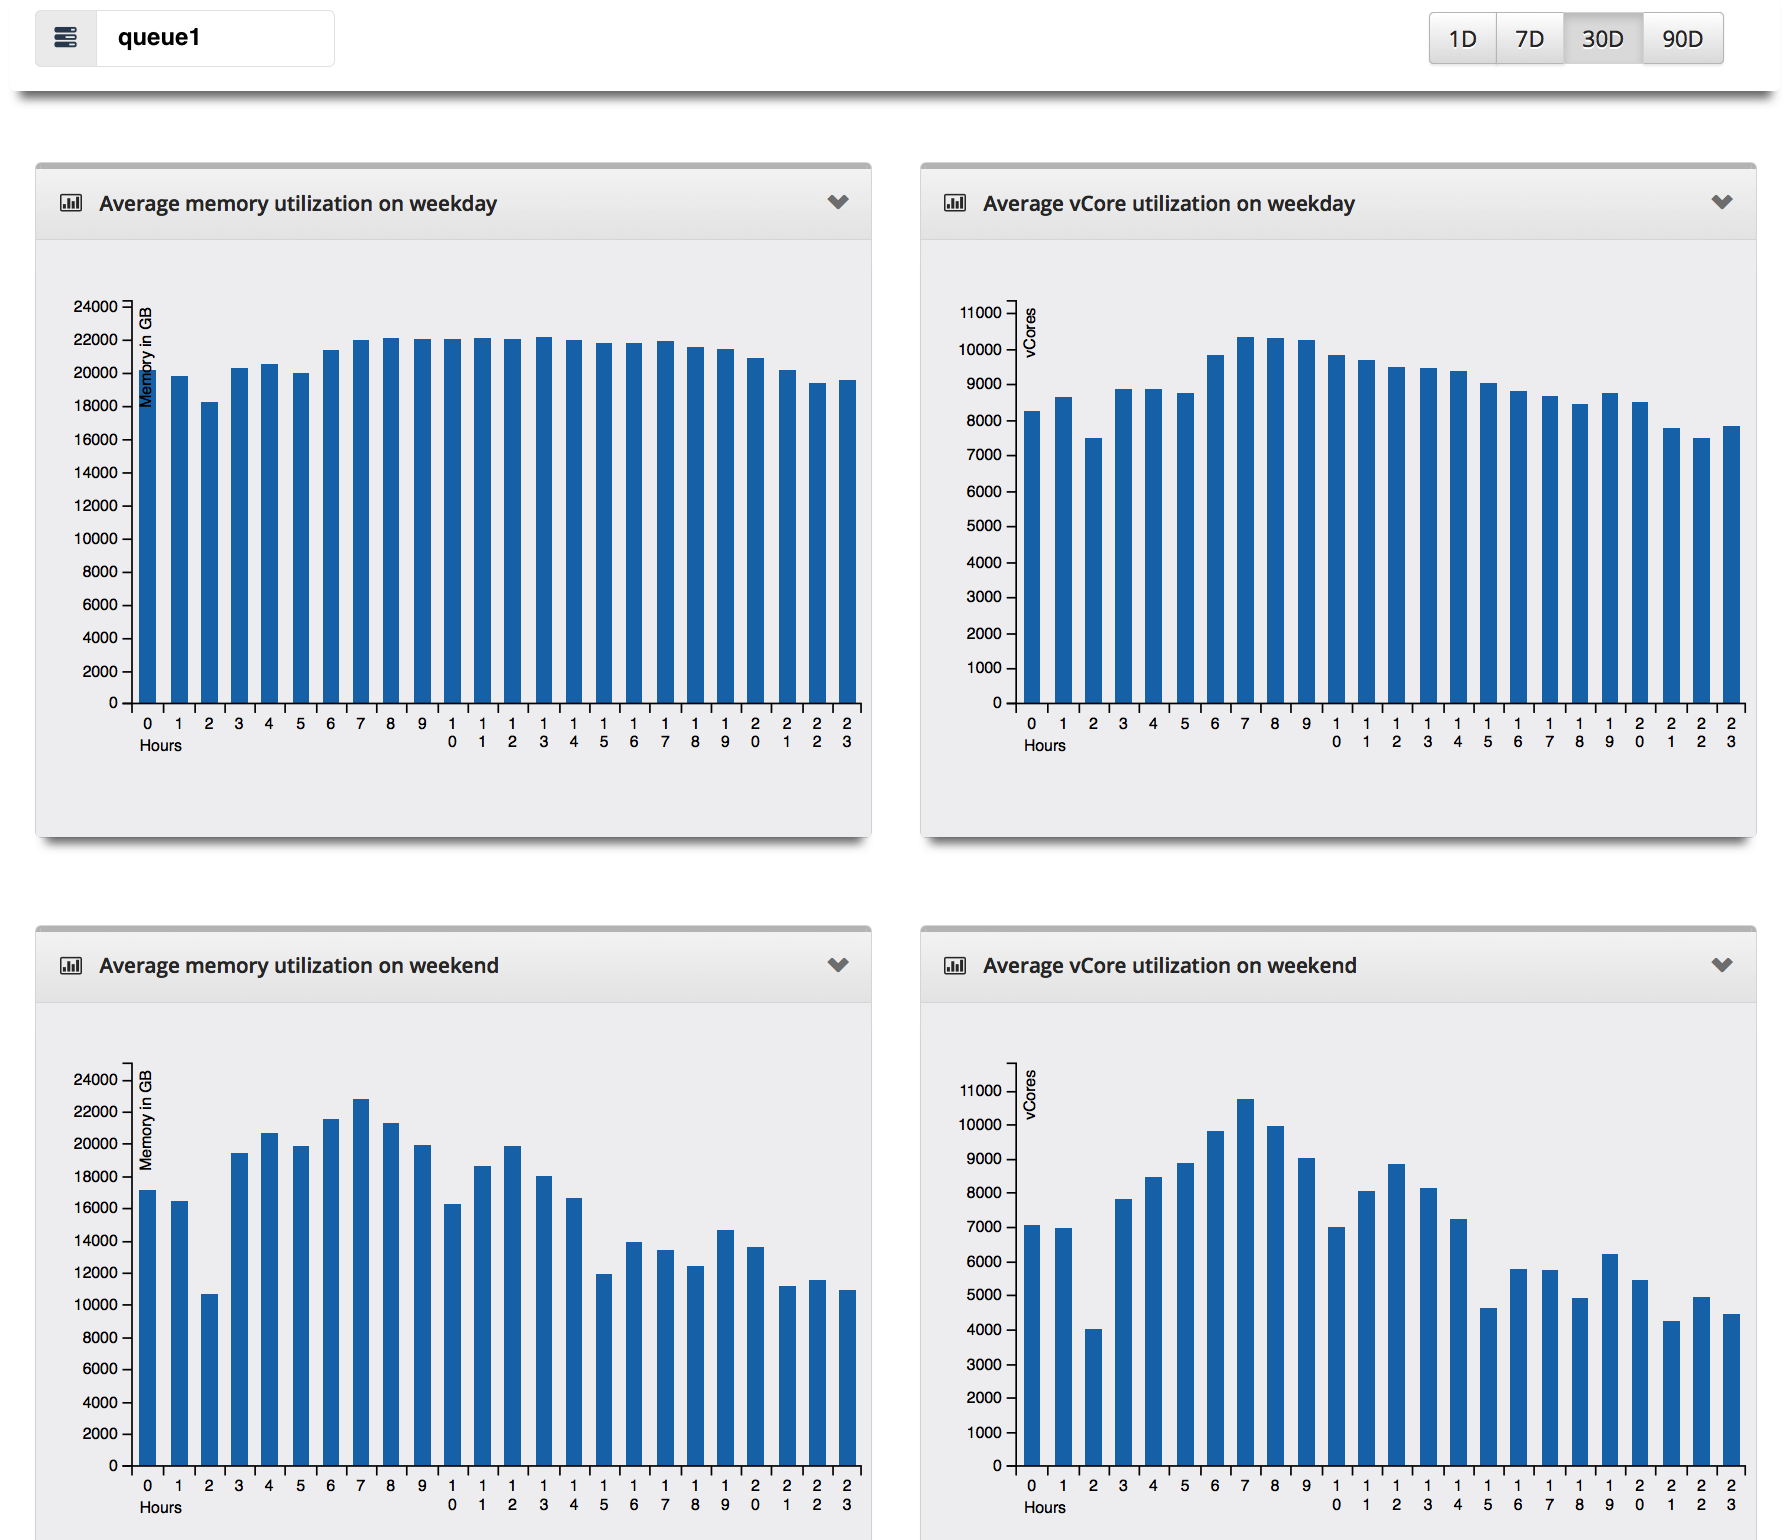
- In each queue or grid, we can see what a general resource utilization looks like on the weekday as well as the weekend. We can also see the top resource consumers and the average wait times for the applications submitted in the queue.
What's Next?
We are always looking for ways to improve Rewinder so that it becomes an increasingly effective tool for our users. Our next steps include making the tool itself more streamlined with additional features that tie a top level Hadoop flows as defined in Azkaban with the underlying task level information to make it more complete.