The Evolution of A/B Testing Platform at LinkedIn
September 21, 2015
“Doubt the conventional wisdom unless you can verify it with reason and experiment” - Steve Albini
At LinkedIn, we experiment with new ideas before trusting our instincts. Experimentation plays an important role in product innovation and business growth. It is an essential ingredient to greater member happiness, stronger business impact and higher talent productivity.
XLNT, an internal LinkedIn platform built to help make data-driven A/B testing decisions, has gained its popularity among various teams and products – everyday, hundreds of experiments are running and being studied on XLNT. Over the past year, XLNT has evolved significantly to a full-fledged platform covering many aspects of A/B testing. We have developed many powerful and yet easy-to-use features to help better run A/B tests and analyze results.
Flexibility: Custom Experimental Unit
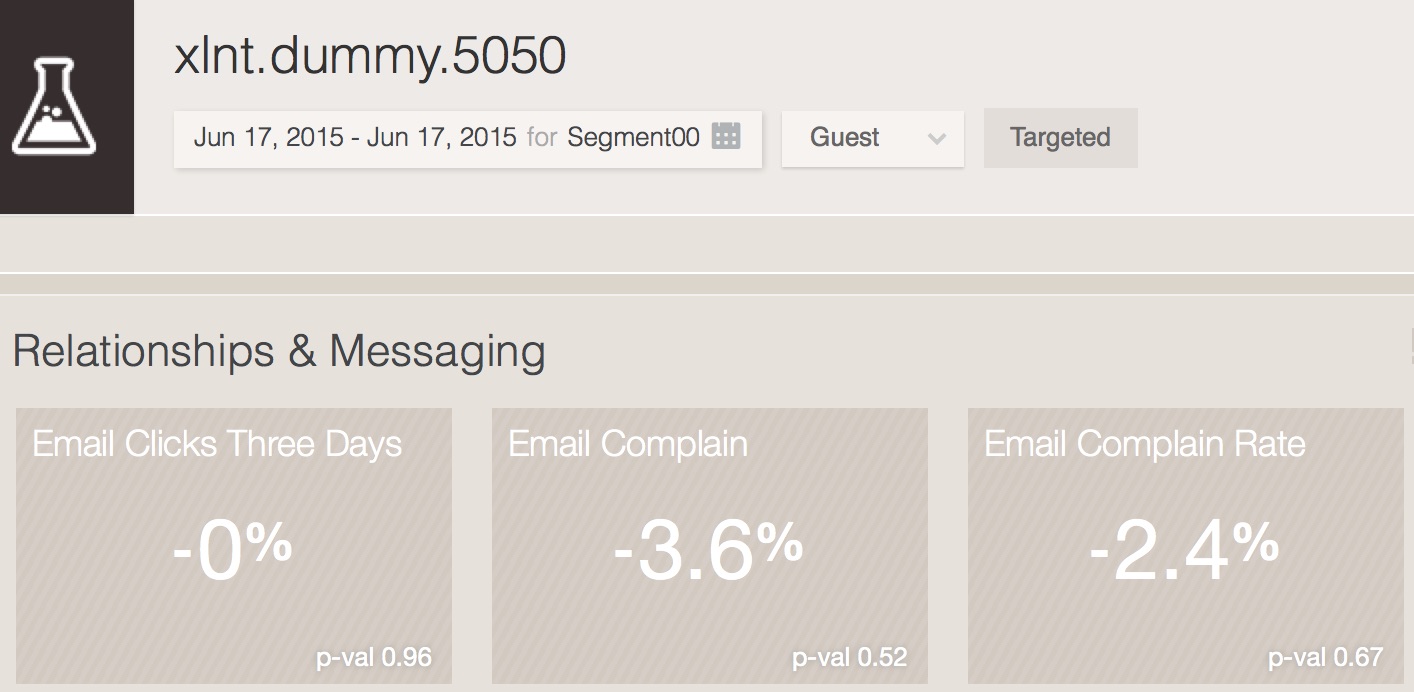
Traditionally, we've focused A/B testing efforts on our members in order to improve their experience using LinkedIn. We are, however, extremely focused on growth as well, and try to give guests users the best experience possible so they'll want to sign up. We do this by letting guests use certain features, like applying for jobs, without signing up and making sure that once they do sign up, the process is easy and fluid. In addition, we aim to provide relevant jobs and informative job descriptions to our audience.With this in mind, we have expanded A/B testing practice to custom experimental units and leveraged XLNT to test products outside our core member platform. With flexible experiment units, we can optimize how we engage guest users, send emails and present jobs through experimentation on XLNT. Analyzing experiments on guest, emails, jobs, and other custom experiment units has never been easier.
Transparency: Metrics You Follow and Ramp Alert
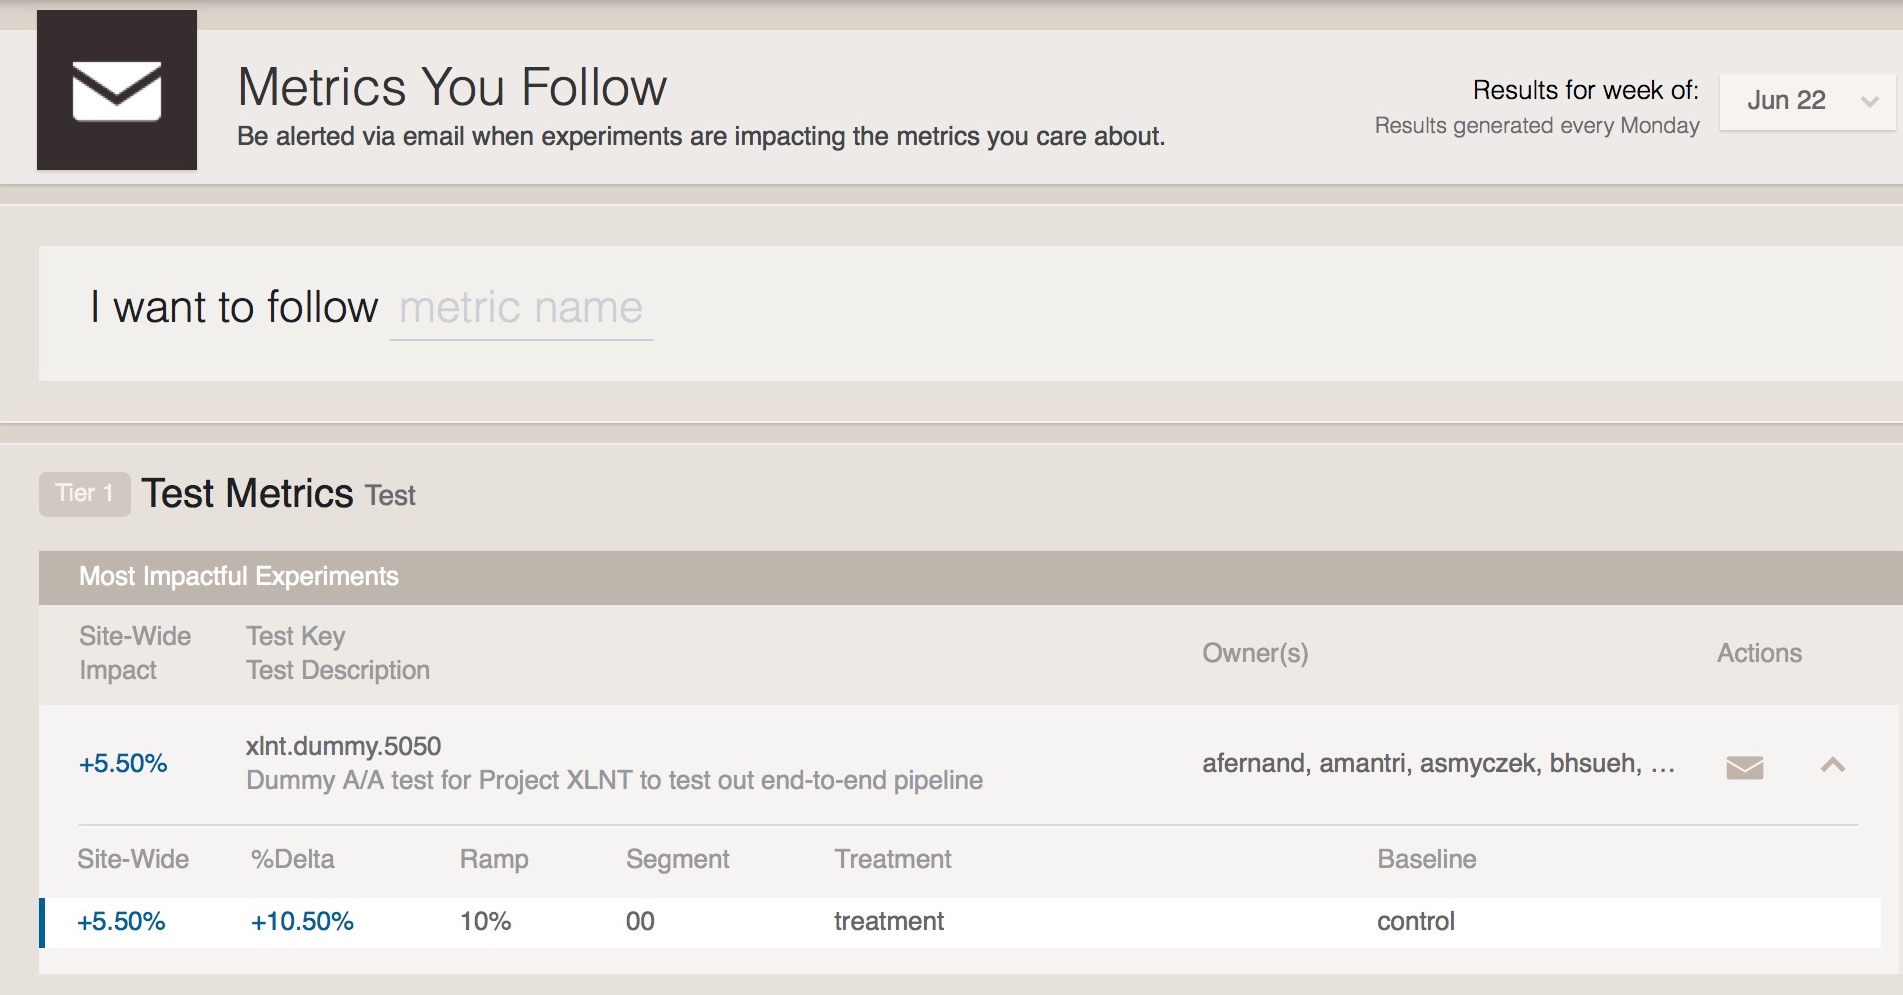
LinkedIn is a fairly large company with various product teams. Every product team is likely to run multiple experiments at one time. As you can imagine, a member in one product area can never possibly be aware of all the experiments that other teams are running. Product owners of LinkedIn have set up, monitor and experiment on their essential metrics on XLNT. However, all the products and features on LinkedIn potentially interact and influence each other. Without a proper channel, locating the source of impact is just as difficult as finding a needle in a haystack.
To provide such a channel, XLNT has developed a feature called “Metrics You Follow”. The “Metrics You Follow” page is the place where LinkedIn employees can subscribe to metrics and get a list of the experiments that are impacting these metrics. The list of experiment are selected and ranked by a multi-criteria algorithm that takes into account experiment population, effect size and metric intrinsic volatility. “Metrics You Follow” bridges the gap between metric followers and experiment owners.
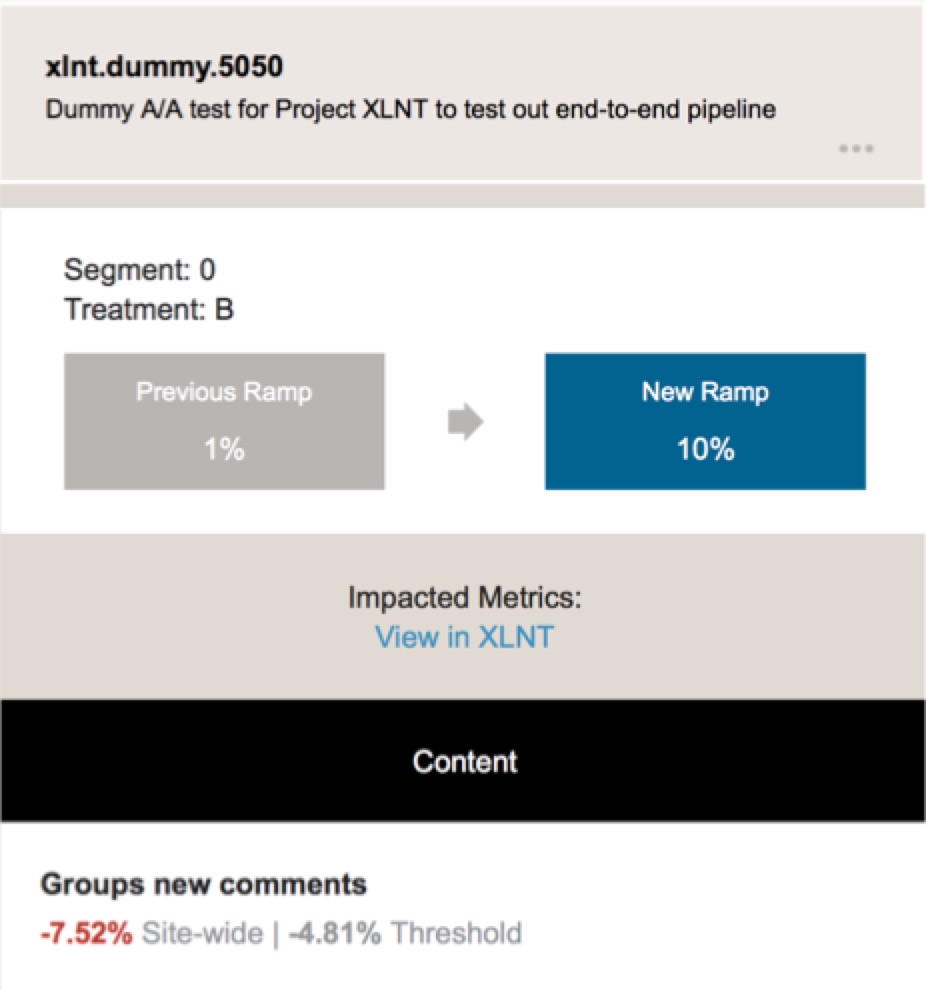
At the end of an A/B experiment, a decision to ramp up or terminate has to be made. Before the decision is made, the experiment owner should review the A/B test results. However, a bad experiment that negatively impacts a metric could be ramped up and it is up to XLNT to alert the experiment “owner” and the metric owner and start the communication between them. Ramp alert feature notifies the experiment owner upon ramp-up request. The metric owner will be notified immediately when an experiment that negatively impacts this metric ramps up in production. With better communication and transparent information, bad experiments can be caught at the early stages.
Data Driven Decision Making: Post Experiment Power
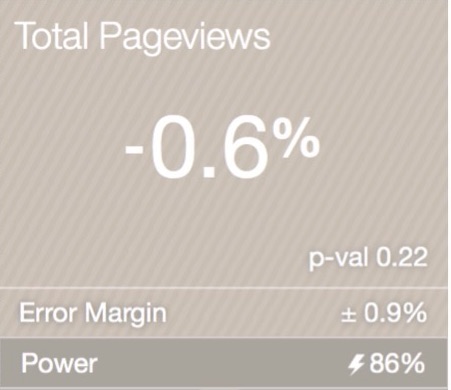
Statistical power measures an experiment’s statistical sensitivity to detect an effect that actually exists. The statistical power of an experiment is essential for business decision-making. An experiment that is underpowered could have a large negative impact without us knowing it. To help run better A/B tests and make more data driven decisions, we have developed the post experiment power feature on XLNT. Prior to running an experiment, the minimal experiment impact (also commonly known as effect size) one wishes to detect are determined and will be used to calculate the statistical power. The post experiment power feature on XLNT not only surfaces the current power values for the comparison between treatment and control, but also provides recommendation on how to achieve enough power if the current power is low. These recommendations are based on the metric’s historical data and current experiment information and can be at experiment level or metric level. The experiment level recommendation tries to achieve enough power for all the important metrics that the every team should be aware of when running an experiment. The metric level recommendation specifically aims to achieve enough power for the metric of interest. These recommendations encourage users to make more informed decisions on the experiments.

Customized and On-demand Analysis: XLNT on Demand
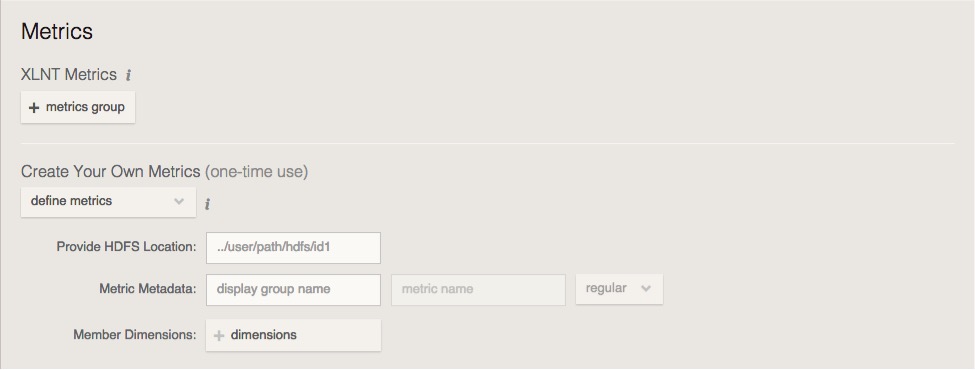
The large-scale unified data pipeline generates standard A/B test reports for all experiments and satisfies most of the needs for experimentation. One unified report does not answer all the questions about one experiment. Users sometimes want to deep dive into an experiment and perform advanced analyses, for example, cohort analysis. XLNT on demand, a tool we recently built, provides such customized and on-demand analysis for an experiment. It allows for customized date range, customized metrics, customized dimensions and even customized members for experiment analysis. Users can also run complex cohort analyses on XLNT on demand. XLNT on demand leverages most of the cool features on XLNT so it eliminates most of the need for ad-hoc A/B testing analysis.
Hundreds of experiments are running on XLNT each day and the number of metric we support has grown to over one thousand. With a goal of providing easy-to-use, accurate and comprehensive A/B testing solution at scale, more great features are to come as XLNT evolves.