Real time insights into LinkedIn's performance using Apache Samza
August 18, 2014
It's not easy to quickly gather all the data that goes into a LinkedIn page view, particularly for something like our home page. LinkedIn benefits from a very distributed service-oriented architecture for assembling pages as quickly possible while still being resilient to failures from any particular bit of content. Each bit that ends up on the page is provided by separate services, each of which often will call upon other, subsequent services in order to finish its work. This approach is great for building a reliable, scalable website, but does make it more challenging to get a holistic view of everything that goes into building those pages, since the effort was distributed across many machines operating independently.
Enter Apache Samza (incubating), which has allowed us to build a near real-time view of how pages are being built across hundreds of different services and thousands of machines. Once we have this data, it's easy for other teams at LinkedIn to ask questions such as, what services are call my service, why does my call take longer today compared to yesterday or, what is the biggest contributor to latency when loading the home page?

Samza is a distributed, real-time stream processing framework that was created at LinkedIn and is currently incubating with the Apache Software Foundation. Samza is very pluggable in what type of data sources it can read and write, but by default consumes from and produces to Apache Kafka, another Apache project out of LinkedIn. LinkedIn uses Kafka extensively to drive real-time site updates, populate metrics and monitoring systems and feed batch processes such as Hadoop. Samza is designed to consume Hadoop-scale data, but to do so on infinite, continuous streams with seconds to sub-second latencies. Martin Kleppmann has previously described the motivation and architecture of Samza, particularly at LinkedIn.
Assembling a page view in hundreds of easy steps
Consider what data is necessary to build a particular view of the LinkedIn home page. We provide interesting news via Pulse, timely updates from your connections in the Network Update Stream, potential new connections from People You May Know, advertisements targeted to your background, and much, much more.
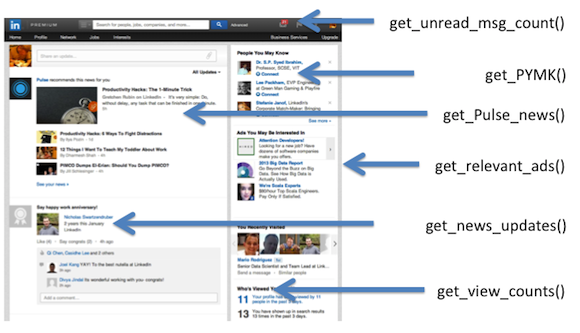
Many services (approximated by simulated API calls here) are involved in completing one user request.
The front end service that handles that initial request creates dozens of parallel REST requests using LinkedIn's Rest.li framework. Each of those services can potentially make more such REST calls. The front end then assembles the results of those calls into the final data for the page. Every time one of these REST calls is made, the server sends a log of the request to Kafka. Each service publishes its logs to its own specific Kafka topic, which is named after the service, i.e. <service>_service_call. There are hundreds of these topics, one for each service and they share the same Avro schema, which allows them to be analyzed together. This schema includes timing information, who called whom, what was returned, etc, as well as the specific of what each particular service call did. Additionally log4j-style warnings and errors are also routed to Kafka in a separate <service>_log_event topic.
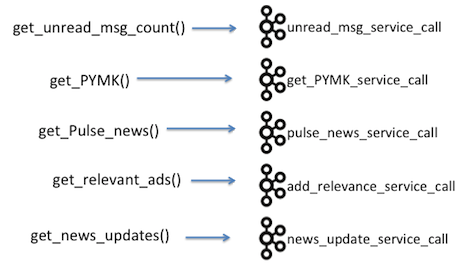
Each service that participates in fulfilling a request logs its activity to Kafka.
After a request has been satisfied, the complete record of all the work that went into generating it is scattered across the Kafka logs for each service that participated. These individual logs are great tools for evaluating the performance and correctness of the individual services themselves, and are carefully monitored by the service owners. But how can we use these individual elements to gain a larger view of the entire chain of calls that created that page? Such a perspective would allow us to see how the calls are interacting with each other, identify slow services or highlight redundant or unnecessary calls.
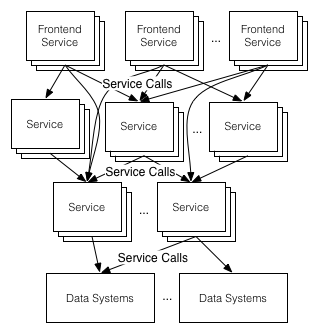
Many services are involved in fulfilling any front end request.
By creating a unique value or GUID for each call at the front end and propagating that value across all subsequent service calls, it's possible to tie them together and define a tree-structure of the calls starting from the front end all the way through to the leave service events. We call this value the TreeID and have built one of the first production Samza workflows at LinkedIn around it: the Call Graph Assembly (CGA) pipeline. All events involved in building the page now have such a TreeID, making it a powerful key on which to join data in new and fascinating ways.
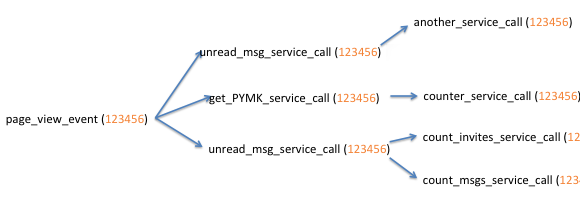
A common TreeID amongst all calls from the same request allows those calls to be stitched together in a tree.
The CGA pipeline consists of two Samza jobs: the first repartitions the events coming from the sundry service call Kafka topics, creating a new key from their TreeIDs, while the second job assembles those repartitioned events into trees corresponding to the original calls from the front end request. This two-stage approach looks quite similar to the classic Map-Reduce approach where mappers will direct records to the correct reducer and those reducers then aggregate them together in some fashion. We expect this will be a common pattern in Samza jobs, particularly those that are implementing continuous, stream-based implementations of work that had previously been done in a batch fashion on Hadoop or similar situations.
| Filter, redirect records | Mapper | Repartition job |
| Process the grouped records | Reduce | Aggregation job |
Job #1: Repartition on TreeId
The first job consumes from all of the service call topics as well as the log event topics from all services across LinkedIn. There are nearly a thousand of these topics and so, rather than manually trying to manage them all, we use Samza's RegExTopicGenerator, which allows users to wildcard their Kafka input topics, and specify *_service_call and *_log_event — a big time saver. Kafka messages are key-value pairs and Samza consumes them based on the hash partitioning on that key. The key of the incoming message is of no interest to this job, which replaces the key with the TreeID from the message itself. Thus the job repartitions the messages based on their TreeID, writing them to a new topic, all_service_calls. Additionally this job takes the opportunity to generate metrics about the incoming events, drop any which are malformed or lack a TreeID and, if so configured, drop some percentage in order to limit the volume of messages sent on to the next job. Similar partitioning and clean up work is done with the log events Kafka topics, which this job also consumes.
The Repartition on TreeID job has been an excellent opportunity to improve the scalability and performance of Samza. Currently it is consuming nearly ten thousand individual Kafka topic-partitions and must process those as quickly as possible in order to provide correct results to the subsequent job. If one container of the job is lagging relative to other containers, the events it emits will be out of sync and arrive late for aggregation in the next job. We've made numerous improvements to Samza to reach these performance requirements, the two largest of which are SAMZA-123, which gives Samza a more flexible partitioning model, and SAMZA-245, which refactored Samza's consumer code to increase throughput. At the moment we see the job processing 600,000 messages per second across all the partitions for the job and it is easily able to keep up with regular traffic surges throughout the day.
Additionally, this job demonstrated a need for Samza to be more flexible in how it groups together topic-partitions. Currently this grouping is based on the partitions of input Kafka topics; if those topics are partitioned 32 ways, there will exactly 32 instances of Samza processors (StreamTasks) and all topics, whether there are just one or a thousand, will be funneled into those 32 instances. This grouping is great if one needs to join on a key, but the Repartition on TreeID job has not such need and can benefit greatly from not being grouped. Instead, we should expand to as many StreamTasks as necessary to keep up with the flow of messages. The recently committed SAMZA-123 patch decouples Samza's processor assignment strategy from the number of input partitions. Jobs such as this one will be able to scale horizontally to a maximum of the number of individual topic partitions across the entire job, in this case potentially up to ten thousand separate StreamTasks.
Job #2: Assemble Call Graph
The second job in the CGA pipeline consumes the repartitioned service events and log events generated by the Repartition by TreeID job and builds complete trees of those events that correspond to the original service calls from the front end request. It effectively acts as a GROUP BY on the TreeID and is windowed to allow all of the component service calls and log events for a particular tree to arrive.
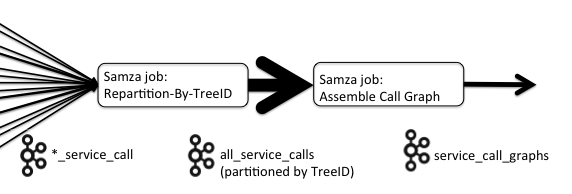
The Assemble Call Graph job consumes the consolidated feed from the Repartition By TreeID job.
The Assemble Call Graph job's approach to windowing is interesting because it needs to take into account any straggling messages either due to slowness in any of the underlying Kafka streams or the previous Repartition on TreeID job. The job maintains a timer for each TreeID that is started on arrival of the first event and is reset on each subsequent event's arrival. If this timer expires, meaning no new events for that TreeID have arrived during the duration, the tree is declared complete, assembled into a graph structure that hopefully mirrors the original series of calls way back at the front end, and emitted to a new topic, all_service_call_graphs. Experimentally we've found that a three minute window is suitable for catching the vast majority of call trees. This is an extremely conservative value, considering how quickly Kafka can process messages, but takes into delay potentially introduced as the events pass through several Kafka clusters and mirror maker instances on their way to our dedicated Kafka cluster.
To protect itself from services that may be re-using TreeIDs incorrectly or otherwise misbehaving, we cap the maximum number of service calls that may be in tree to one thousand and, should a TreeID hit this limit, it is blacklisted from the job for 24 hours and the elements we've received thus far are shunted off to another topic, cga_blacklist. Our performance team is quite keen to follow up on the TreeIDs that populate this topic to investigate these ne'er do well events.
Tools built atop the CGA pipeline output
Currently we are constructing many millions of call trees per day and this number increases constantly as we bring more services online. The output of this pipeline is consumed by both LinkedIn's performance and tools team to monitor the site in near real time. The Performance team in particular has built tools to aggregate the trees we create and compare them over time to find changes in their structure, laggard components in the tree and unexplained additions or deletions from it.
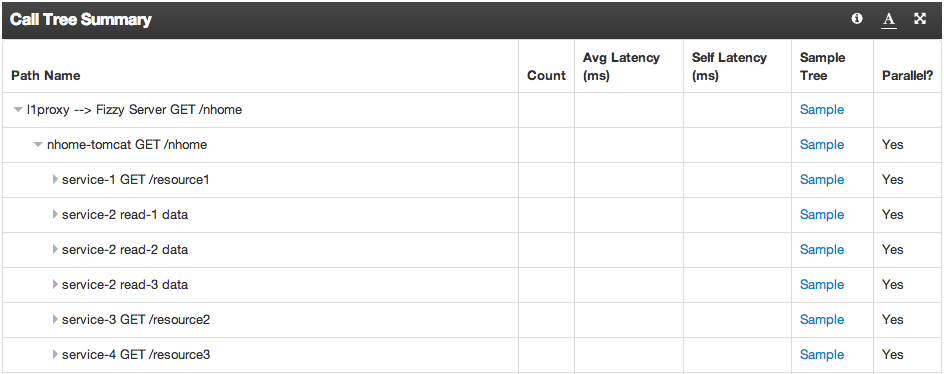
The Performance team at LinkedIn is building interactive tools atop the Call Graph Assembly job. The service names and resources have been redacted in this picture.
One use case is LinkedIn’s INCapacity, which consumes CGA events and constructs real-time callgraphs over thousands of servers for performance analysis and capacity planning. Performance analysis of a website on scale of LinkedIn is difficult even in the best of times. This task becomes extremely difficult when under intense pressure to fix a site performance issue. The callgraphs of INcapacity takes the guess work out of performance troubleshooting as they stack rank the call paths that are slowest and the services that are the longest poles.
Look for a blog post soon from the Performance team discussing, in part, further how they use the CGA to improve LinkedIn.
Conclusion
Previously it had been possible to laboriously build similar structures in Hadoop using Pig or Hive after all the of the data had been ETLed from the Kafka clusters. Now, all of the services that were involved in fulfilling a front end request can be visualized and explored seconds after that request is completed. As one of the first production Samza pipelines at LinkedIn, CGA has been an excellent opportunity to test, harden and improve Samza.
Acknowledgments
Many thanks to LinkedIn's performance, service infrastructure, and tools teams, in particular, Cuong Tran, Toon Sripatanaskul, Thomas Goetze, Badri Sridharan, Nick Baggott, Christopher Coleman and Jaroslaw Odzga.