

Engineering Infrastructure at Scale: Test Tracking
This blog series describes the engineering infrastructure (technologies, processes, tools, and culture) that enables several hundred engineers across LinkedIn to innovate and release software continuously with agility, quality, and productivity. This post describes the analytics infrastructure across iOS, Android, web, and API.
In order to collect information on how members interact with LinkedIn apps and websites, we've built a powerful tracking infrastructure framework at LinkedIn. This framework has allowed us to assess whether new features are successful, to conduct business auditing, and to gain insight into member behavior in general. What we call “tracking” is also referred to as “metrics” or “analytics” at some companies.
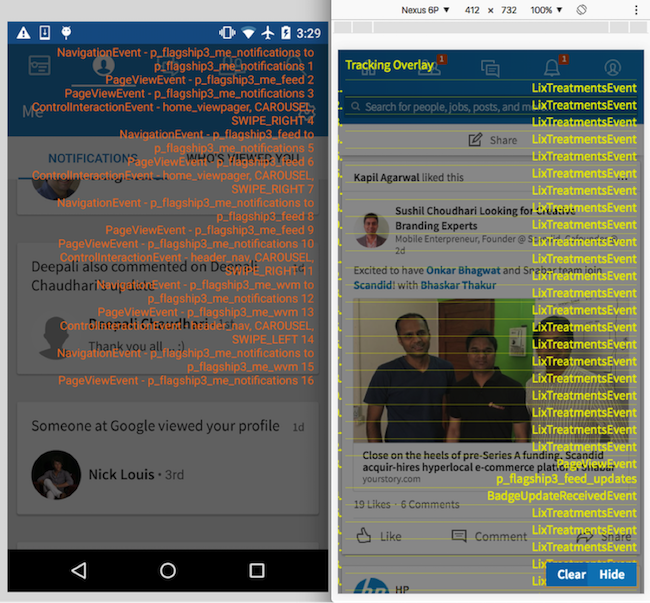
To give you a taste of how we track events, let's walk through an example where a member is using the LinkedIn mobile app, and scrolling through his feed, when he sees a "Sponsored Update," which he then likes. (See the iPhone screenshot below with our Tracking Overlay feature turned on.)
At a high level, the following tracking events are generated as members interact with the LinkedIn apps and websites:
UI events
PageViewEvent (PVE): fired when a page is shown. The key information is the pageKey that uniquely identifies the page. A full page (or “anchor page”) may contain several sub-pages (or “non-anchor pages”), so several PVEs may be fired for one anchor page, like event 04 PVE for full page, p_flagship3_feed, and event 05 PVE for subpage, p_flagship3_feed_updates, both fired for the same home (aka feed) page, as seen in the iOS screenshot.
ControlInteractionEvent (CIE): fired when members interact with controls, like pressing a button. The key pieces of information are the control’s name (e.g., controlUrn) and action type (e.g., interactionType, like SHORT_PRESS, FLICK_UP, SWIPE_LEFT). In the iOS screenshot, the like button is highlighted, and the event 07 CIE, SHORT_PRESS like_toggle p_flagship3_feed, indicates that the member just pressed the like button on the home page.
NavigationEvent (NE): fired when members navigate from one anchor page to another. The key pieces of information are previous and current pageKeys and the triggering control. Event 03, NavigationEvent p_flagship3_feed, shows that the member closed the dialog showing an article (event 01, SHORT_PRESS close p_flagshp3_feed_web_viewer) and navigated back to the feed page (event 04, PageViewEvent p_flagship3_feed).
Product Events (aka Custom Event, Semantic Event): while it is interesting to report that the like button on the feed page has been clicked, it is far more useful to report the semantic information that a particular member liked a particular sponsored update. So for each UI event, there may be several product events with valuable semantic information about the specific content and interaction, like:
ImpressionEvent: event 06, FeedImpressionEvent, contains semantic information about the particular sponsored update post. ImpressionEvent has some display criteria before it can be fired, specified as a rule; for example, “50% of the view must be shown for more than half a second.” The rule is customizable by app code.
ActionEvent: event 08 is a FeedActionEvent, which contains all the semantic information about the interaction in which this particular member liked this particular sponsored update.
All tracking event types have Avro/Pegasus schema definitions for their data format.
Here is the end-to-end flow of the whole tracking system:
The Android, iOS and web clients call the API frontend via Rest.li protocol to get data.
The API frontend in turn calls mid-tiers and backends to get data. Along the call tree, various tracking events (mostly XxxServedEvents) are fired and sent to Kafka for processing by downstream tracking consumers.
The data is returned to clients for rendering. As members interact with the clients, tracking events (both UI and product events) are fired and sent to Tracking-Frontend (aka “Tracking-FE”), which validates and processes these events before passing them along to Kafka for downstream tracking consumers.
The specification, monitoring, and analytics of all tracking events are managed by an internal tool called Callisto:
The above screenshot shows a fictitious anchor page identified by pagekey x_prod_pillar_key: the UI; the product, engineering, testing, relevance, and analytics owners of this page; sub-pagekeys, controls, custom/product events defined on this page; the inflow and outflow of this page (i.e., how members navigate to and from this page), and various analytics information for this page.
Tracking infrastructure
The code in each of the major “Pillars” (or “Tabs,” such as Feed, Notifications, and Messaging) on iOS, Android, and web could each try to generate their tracking events in JSON format compliant with schema definitions, fill out the dozens of fields in the three common headers, and send them to Tracking-FE, with batching, retry, and persistence logic. But it is far better to have a common tracking infrastructure that hides all the complexity from app code, automates and optimizes the overall tracking flow (firing, testing, debugging, and monitoring), makes pillar code as simple as possible, and ensures consistency and accuracy across platforms.
The below sample code shows how to fire and test tracking events with the tracking infrastructure on Android, iOS, and web:
Tracking firing
For iOS, Android, and API, the statically typed languages Swift, Objective-C, and Java are used, we codegen the Avro/Pegasus schema of tracking events into classes in these languages. These classes handle serialization to and deserialization from JSON format efficiently, as well as validating and ensuring schema compliance so that no invalid tracking events can be generated, sent, or received. The generated code uses the Builder pattern to construct tracking events between pillar code and tracking infra, and uses class hierarchy (both the event classes and their builder classes) to simplify the interface of tracking infra.
Tracking infrastructure maintains the global state so it can fill in the three common headers, automatically generate events like NavigationEvent as the member navigates from one page to another, and send tracking events to Tracking-FE with batching, retry, error handling, and persistence efficiently.
UI events (PageViewEvent, ControlInteractionEvent, NavigationEvent) are tied to views’ lifecycle events and controls’ listener events and generated automatically by tracking infra in base classes. Pillar classes inherit these base classes and implement the abstract methods to provide necessary tracking info; then, tracking events are fired for them automatically, as shown in above sample code in Java and Swift:
PageViewEvent: pillar’s Fragment (Android)/ViewController(iOS) classes inherit from base classes and only need to specify their own pageKey. PageViewEvents are fired for them automatically.
NavigationEvent: NavigationEvents are fully automated, as tracking infra maintains the global navigation stack and generates NavigationEvents as a member navigates from page to page. Pillar code doesn’t need to do anything.
ControlInteractionEvent: pillar code needs to specify a control’s name. For iOS, tracking infra swizzles the event handlers, so ControlInteractionEvents are auto-generated and completely transparent to pillar code. For Android, pillar’s listener classes need to inherit from these TrackingXXXListeners base classes, then ControlInteractionEvents are auto-generated.
- Product events: these events are mostly fired by pillar code and need semantic information about specific content and interactions that only the pillar code knows. Tracking Infra uses Builder pattern and Covariant parallel class hierarchies of events and their builders to create a simple and elegant interface. Pillar code uses event-specific builders to set the event-specific fields, then passes the builders to tracking infrastructure, which fills in common headers and then calls .build() to generate the specific event object. For infinitely scrollable views like UICollectionView and RecyclerView, tracking infra’s base class collaborates with pillar subclasses to fire PageViewEvent and ImpressionEvent with customizable impression criteria, as items scroll over the screen.
Tracking testing
Tracking is an important part of the functional spec of any feature. 100% automated test coverage of tracking is required. Tracking infrastructure makes it super easy to test tracking and report test coverage.
Tracking infrastructure provides test utilities that can be easily added to existing test code to verify that expected tracking events and only expected tracking events are fired by the test code, as shown in the above sample code. Take the PageViewEvent and ControlInteractionEvent test below, for example. Adding the below annotation (Java) or code (Swift and JavaScript) to existing tests will turn on tracking validation:
Java: @Tracking(page = {“pageKey1”, “pageKey2”}, interaction = {“ctrlId1”})
Swift: .expect(pageViewEvent("pageKey1")).expect(interactionEvent("ctrlId1", .SHORT_PRESS))
JavaScript:
trackingSession.assertPageViewEvent('pageKey1').occurs(2);
trackingSession.assertInteractionEvent('ctrlId1').withInteractionType('SHORT_PRESS');
Tracking test utilities also output tracking events tested in test log after each test run. These logs are aggregated and compared against tracking specs to report tracking test coverage, as part of the Continuous Integration pipeline.
Tracking debugging
- Tracking Overlay: Tracking Overlay is implemented across iOS, Android, and web. Dev, test, product managers, and data scientists can easily turn it on and debug tracking events across platforms. We introduced the tracking overlay feature for Android, web, and iOS at the beginning of the post.
- Charles Proxy: Engineers often use Charles Proxy to analyze the complete JSON payload for generated tracking events while debugging their code.
Sometimes we need to look at Tracking-FE logs and Kafka reports for end-to-end debugging.
Sometimes we need to look at Tracking-FE logs and Kafka reports for end-to-end debugging.
Tracking monitoring
We have many internal tools (like Callisto, Spectrometer, Reportal, and inGraphs) that monitor tracking events and trigger alerts when any anomaly is detected.
Summary
Like other infrastructure systems, tracking infrastructure includes technologies, tools, processes, and culture, built by many teams across the company, for the specification, development, testing, and monitoring of tracking across platforms and apps.
Culturally, we treat tracking as part of the functional spec of any feature. We take a disciplined, holistic, and systematic engineering approach to tracking, from specification to monitoring. Technology-wise, the Avro/Pegasus schema, code generation, auto generation of UI tracking events, etc., make tracking implementation easy and reliable. The separation of syntactic UI events (PageViewEvent, ControlInteractionEvent, NavigationEvent) and semantic product events makes backend tracking analysis much easier and more scalable.
We’ve built lots of great tools that make tracking specification, implementation, testing, monitoring, and evolving much easier. Great real-time and offline tracking information in turn enables us to make the right decision based on real member data and business metrics. Process-wise, the CI/CD pipeline ensures tracking is done correctly before release, and company-wide quarterly data quality sign offs ensure the quality of tracking data.