Social Networking in Developing Regions
March 18, 2012
One of our stellar interns last summer, Azarias Reda from the University of Michigan, explored how users from emerging economies are interacting with social networking. He analyzed LinkedIn's unique data set, which includes access to demographic, activity, career, and educational information for 150+ million members, representing professionals from every country in the world, including several million in Africa and a strong presence in Asia and Latin America.
We recently published this large-scale data analysis in a paper[1] at the Fifth International Conference on Information and Communication Technologies and Development (ICTD 2012) and I’m happy to present the results here:
Social Networking in Developing Regions (PDF)
Developing Regions
As mobile and Internet penetration improve worldwide, users from developing countries are participating in increasing numbers in online communities. Several studies of web usage patterns in developing country contexts indicate Internet users in these areas are very engaged in online social networking and communication tools, spending a significant portion of their online time on them. These observations have been made across several usage scenarios, ranging from educational institutions in urban India to remote Internet access sites in Africa and Latin America.
The Social Networking in Developing Regions paper we presented at ICTD 2012 provided the first large scale and detailed analysis of social networking usage in developing country contexts. Our analysis was based on profile and activity data from LinkedIn members. As part of the work, we analyzed data in understanding social networking usage in the developing world under six themes:
- Connections
- Activity
- Access devices
- Demographics
- Education and careers
- Local languages.
In this blog post, I’ll give you a preview of the paper by presenting the analysis for the first theme, “Connections”. For the rest of the themes check out the full paper.
Connections
Online social networks enable participants to establish connections with members from around the world. Here we investigate the makeup of these connections.
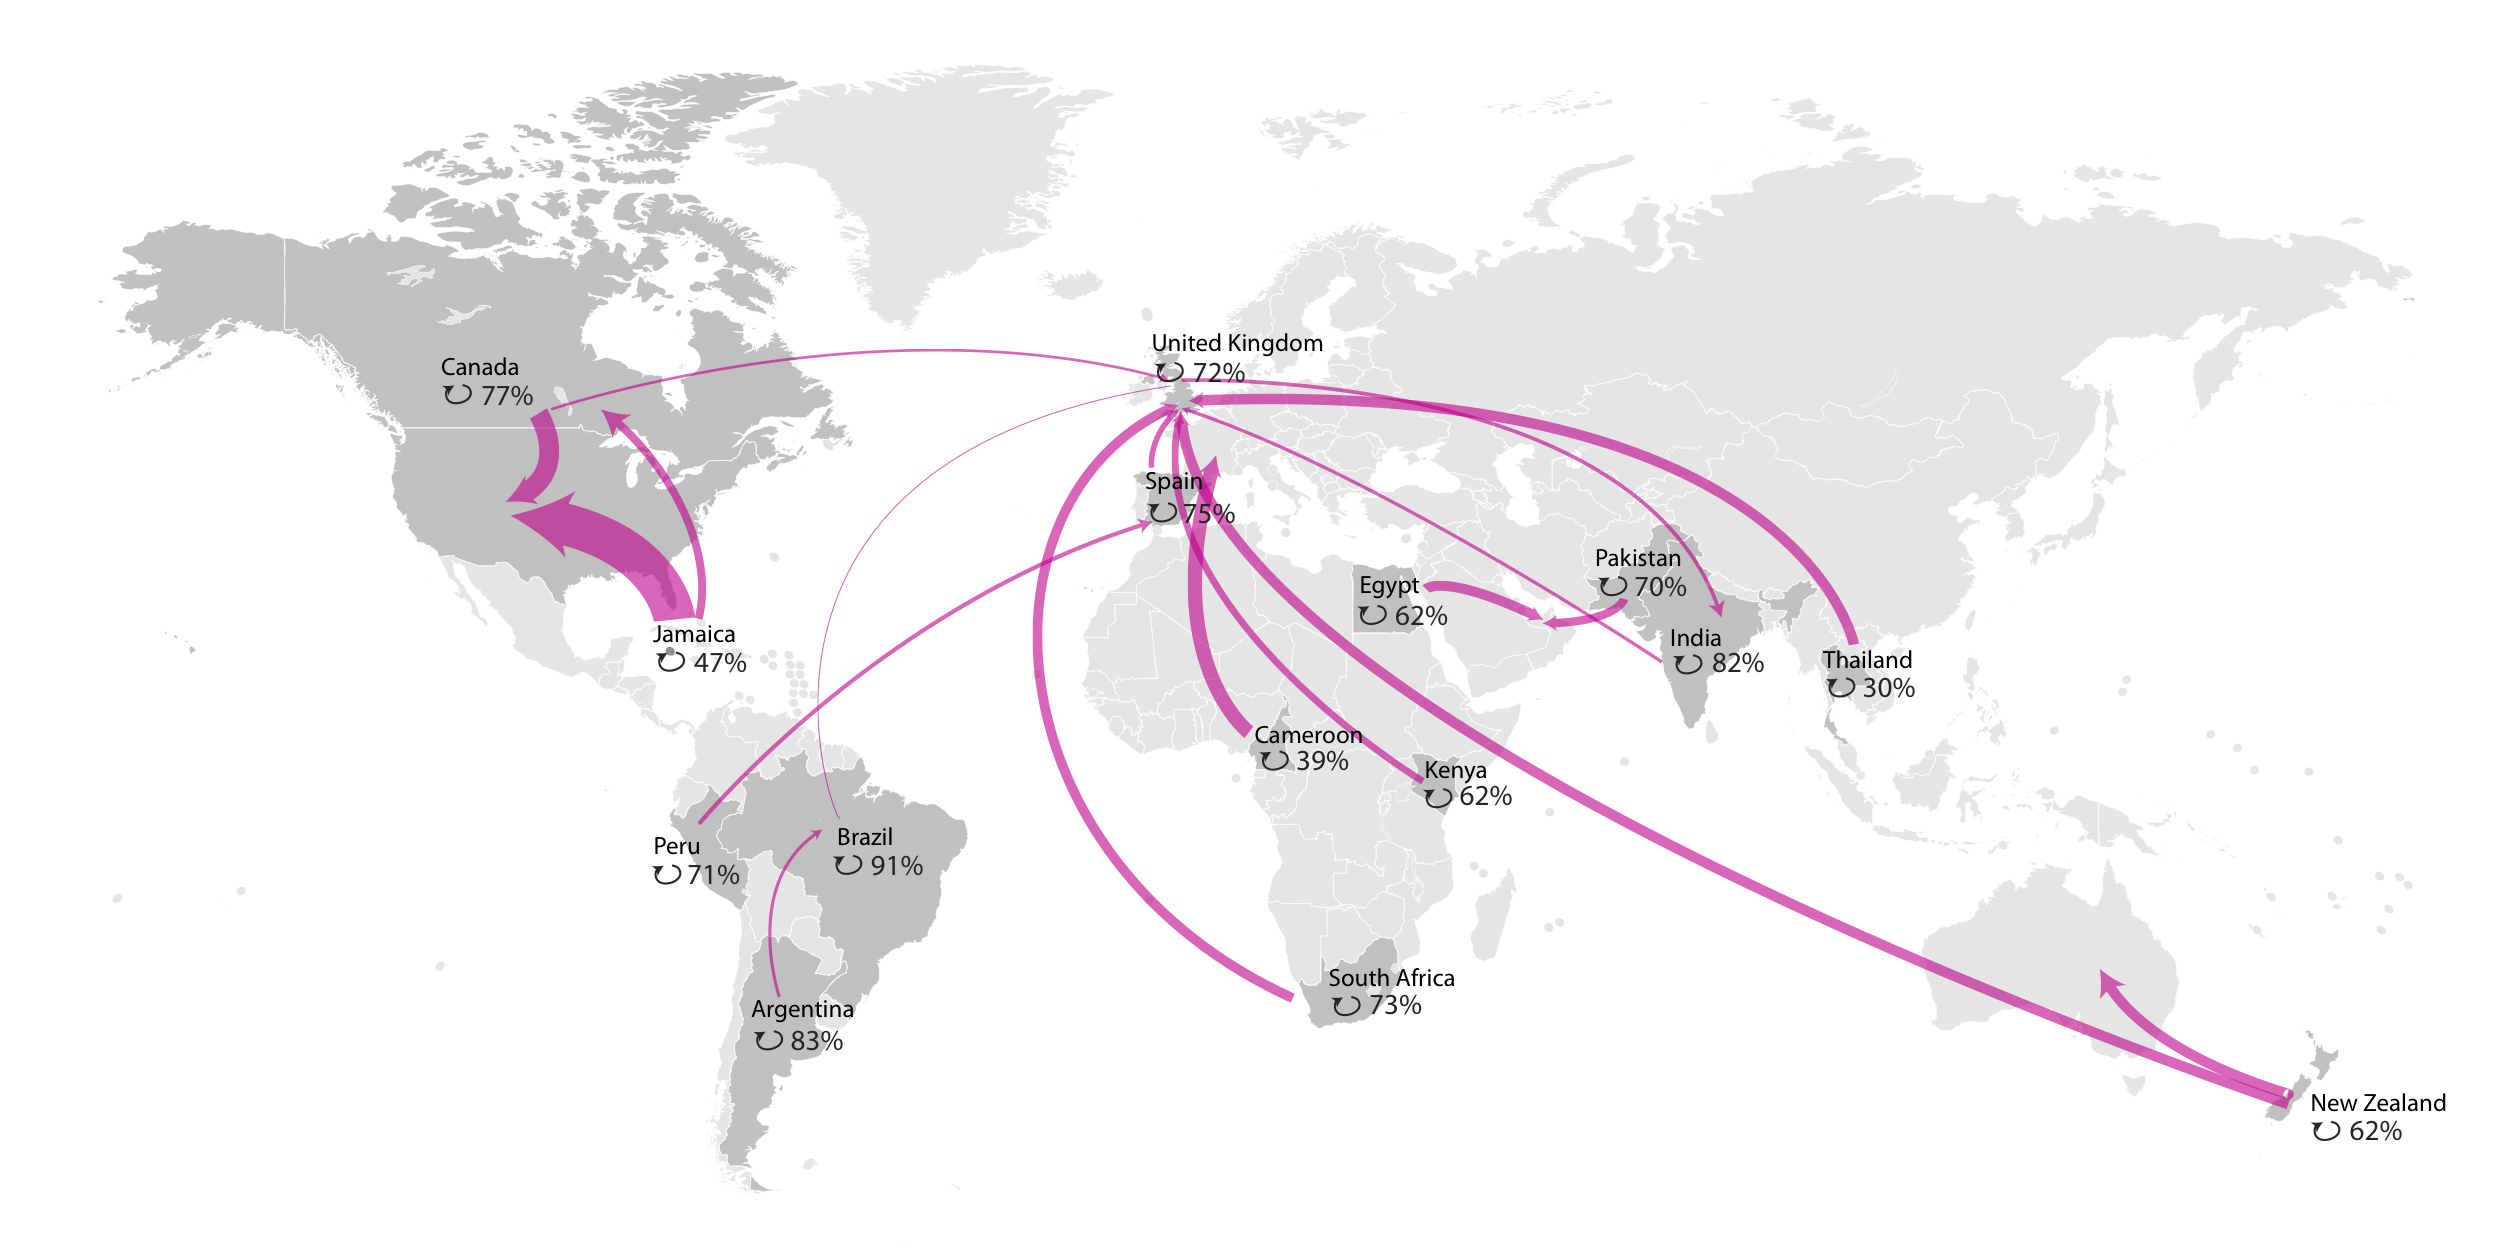
For connections that do not terminate in the same geographic region, we consider patterns in cross-country and cross-continental relationships. The following figure shows a branching map that depicts where outbound connections terminate for selected countries. For each country, we show a few countries where members in the originating country have connections to. The thickness of the line for each arrow corresponds with the fractions of connections that terminate in the destination country.
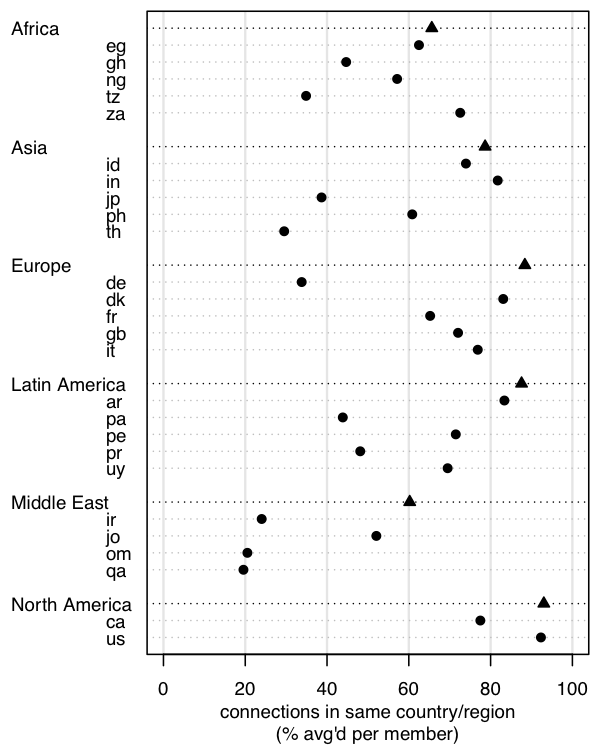
An interesting pattern in analyzing social network connections is the interconnectedness of members within a region, or the locality of relationships. We express the geographic locality of relationships by computing the ratio of connections that are established to members within the same geographic region.
The following figure shows the interconnectedness of various regions. For each region represented, we also provide a few selected countries from the same region, and consider connection locality at the country level. Africa and the Middle East have two of the lowest rates of geographic locality: nearly 40% of connections in each respective region are established with members outside the region.
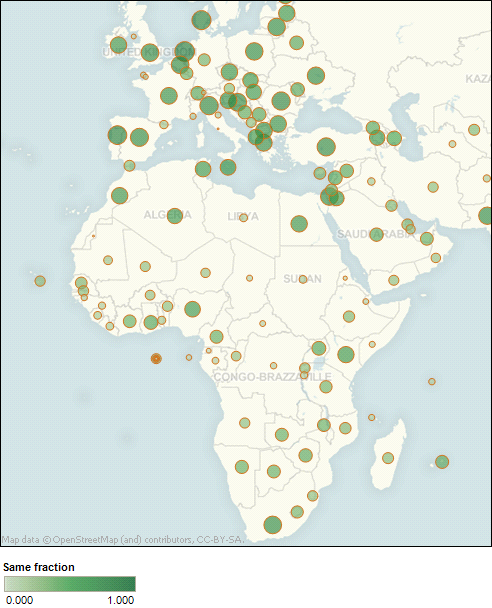
Next we analyzed geographic locality of connections for all countries in Europe and Africa. In the following figure we show connection locality by dots, as the dots on the map of each country get larger and darker, connection locality increases.
Another interesting way of looking at connection distributions is to consider how far connected members are from each other. Using location information, we estimate the distance between members using the Haversine distance function. The following two figures show connection distance for different regions and a selection of countries.
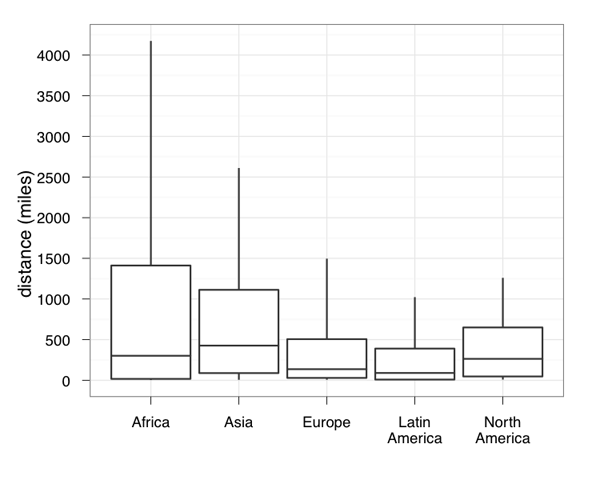
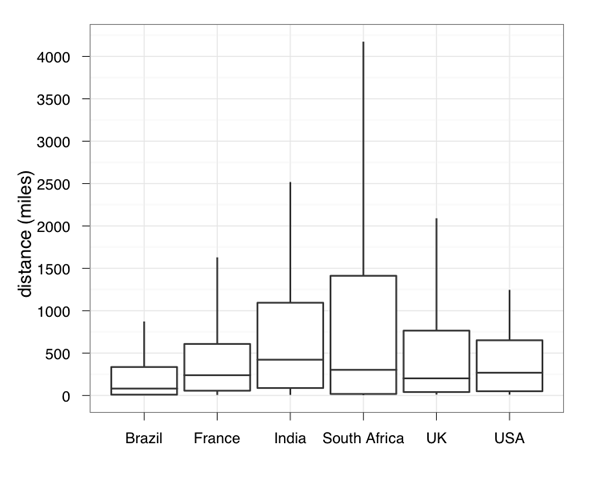
In the above two figures, for each region, the distance distribution is computed by considering all connections that originate from the region. On average, Africa and Asia have the two longest distances for connections, and this is also reflected in the individual countries represented. Several reasons, including geographic attributes of the region and the rate of connection locality, affect this distribution.
Read on
The goal of this analysis is to provide a revealing look on the growth, adoption, and characteristics of social networking in developing countries. Read the full paper paper for more details on the rest of the themes.
Reference
[1] Social Networking in Developing Regions, Azarias Reda, Sam Shah, Mitul Tiwari, Anita Lillie, and Brian Noble. In Proceedings of the International conference on Information and Communication Technologies and Development (ICTD), March 2012.