Hadoop and Near Real Time Analytics at SlideShare
April 15, 2014
Hadoop and Near Real Time Analytics at SlideShare
The upgrade process and what we learnt along the way
At SlideShare-LinkedIn, we’re driven by the motto of "Members First" and constantly look for ways to make the product more valuable for our community. Last year, we upgraded by launching a new version of the analytics [1] and migrated all data points based on HAProxy logs to Hadoop/HBase infrastructure. We’re happy to announce that on April 11 we achieved another major milestone - we launched near real time analytics. Data points are now being updated after a lag of just 30-90 mins instead of the former time lag of 24-36 hrs!
We’re writing this post to share our journey so far with you - starting from 3 nodes POC to current 31 nodes highly available Hadoop/HBase cluster with no SPOF for masters supporting near real time analytics [see section on "HA Setup for Hadoop/HBase Masters" for details].
We started with an early version of CDH4 distribution for Hadoop [2] and after multiple upgrades that brought a lot of useful features, we’re now running CDH 4.3.0 [3] in production (we are really excited about our next major upgrade to CDH5).
Need for Hadoop
Previously, analytics were backed by MySQL and a supporting Ruby batch processing infrastructure.
When we started thinking about new backend system for building analytics from scratch, we had the following requirements in mind:
1. Better latency: Old analytics was slow and sometimes not the most user-friendly.
2. Horizontal scalability: In terms of number of users and data it can process.
3. Supporting other products in future: We use MongoDB for some of our products and we could eventually move some of these products in particular Newsfeed to HBase.
4. Adhoc analysis: We wanted to increase Hadoop usage across the company to get better insights from different datasets and logs. Search and newsletter activity could benefit from adhoc analysis.
5. Near real time analytics: Our goal was to make analytics near real time
6. More analytics features: Introducing additional features that have been part of the product roadmap but haven’t been implemented yet because of the limitations of the old analytics infrastructure.
Selection of Technologies
While we were fairly certain about selection of Hadoop [3] for processing the ever-increasing datasets including HAProxy logs, there were other technologies we had to select to make our Hadoop ecosystem complete.
1. HBase (Database):
HBase [4] leverages Hadoop HDFS for its storage and integrates well with Hadoop ecosystem. Its architecture designed for doing bulk writes and low latency random reads made it a clear cut choice for DB layer.
2. Pig (MR jobs):
For writing MR jobs we wanted to use a high level language with good performance and optimization. Pig [5] comes with good support for HBase storage and load functions. Moreover, you can extend by writing your own UDFs [6]. It's also very easy to use by non-Hadoop or non-tech guys.
3. Oozie (Workflow Scheduler):
First, we started with a bunch cron jobs and when it became unmanageable to run interdependent MR/Pig jobs, we switched to Oozie [7]. It was a steep learning curve but we have found it to be a good investment.
4. Java (MR jobs/Oozie API/Pig UDFs):
It's hard to avoid Java when you're working in a Hadoop ecosystem. Initially, we were skeptical about using Java. Our stage 1 jobs, which directly process raw logs are written in Java because we can use LoadIncrementalHFiles [8] to bulk write HFiles [9] and skip write path completely. It reduces the load on cluster and decreases the time required to complete stage 1 of our data processing pipeline.
We also use Java for writing Pig UDFs.
5. TorqueBox/JRuby (REST API/SOA):
When we launched our new analytics, we were using Thrift client to access HBase API. Eventually as the aggregation logic became complex, we decided to write REST API for analytics data points using TorqueBox [10]. TorqueBox is a high performance [11] application server written in JRuby [12] on top of JBoss. With JRuby, we now have the freedom to use HBase Java API completely. In future, we'll also have an option to move to a more performant HBase client if need be.
6. Phoenix (SQL for HBase):
Phoenix [13] is an excellent project that allows you to write SQL queries over HBase tables and get answers with decent latency. We use Phoenix to generate on the fly reports for user or presentation for custom date range. Phoenix converts your SQL query to scans and uses filters and coprocessors to do the magic!
Data Collection and Processing Pipeline
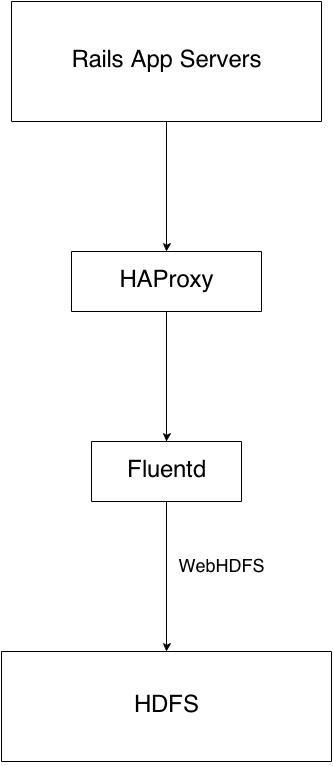
Fig 1: Hadoop Analytics Data Collection
As you can see above, we use a log collection and aggregation tool, Fluentd to collect the HAProxy logs from different sources, buffered into 64MB chunks and pushed into the HDFS sink through the webHDFS interface that Hadoop offers. A new file is created every hour to allow for hourly batch processing.
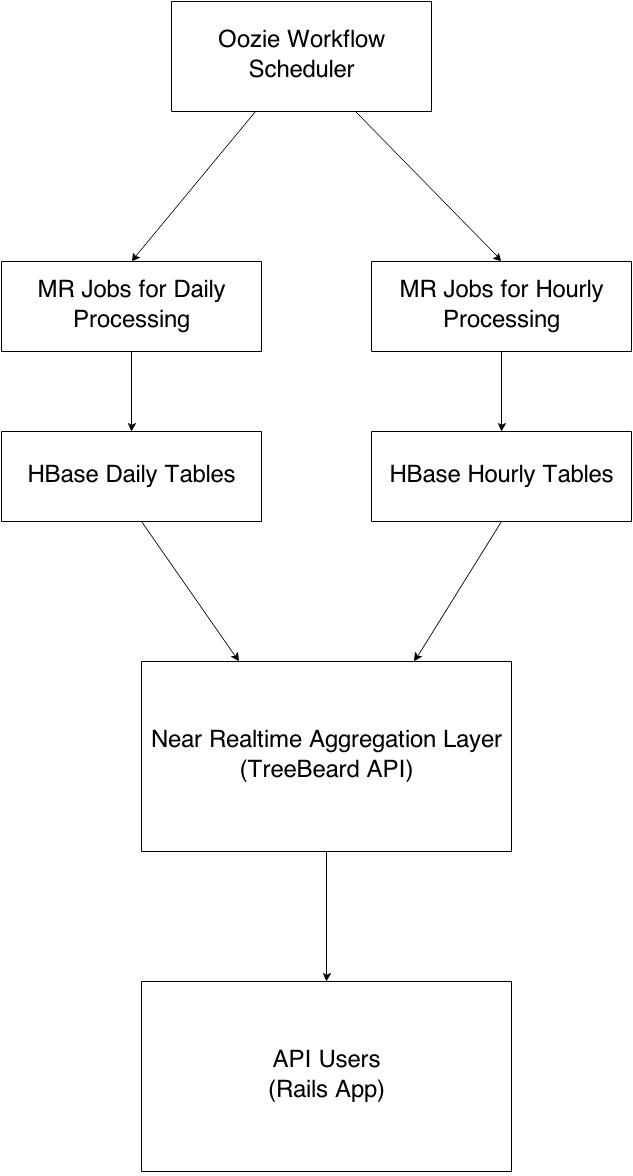
Fig 2: Data Processing Pipeline - High Level
At a high level, the whole analytics data processing pipeline is divided into two independent parallel components that run separately as 2 Oozie coordinators. While daily data processing pipeline runs once a day, hourly data processing runs every hour. Data processed from these 2 pipelines are then combined and aggregated using an API layer known as TreeBeard. REST API exposed by TreeBeard gives most of the data points required by analytics.
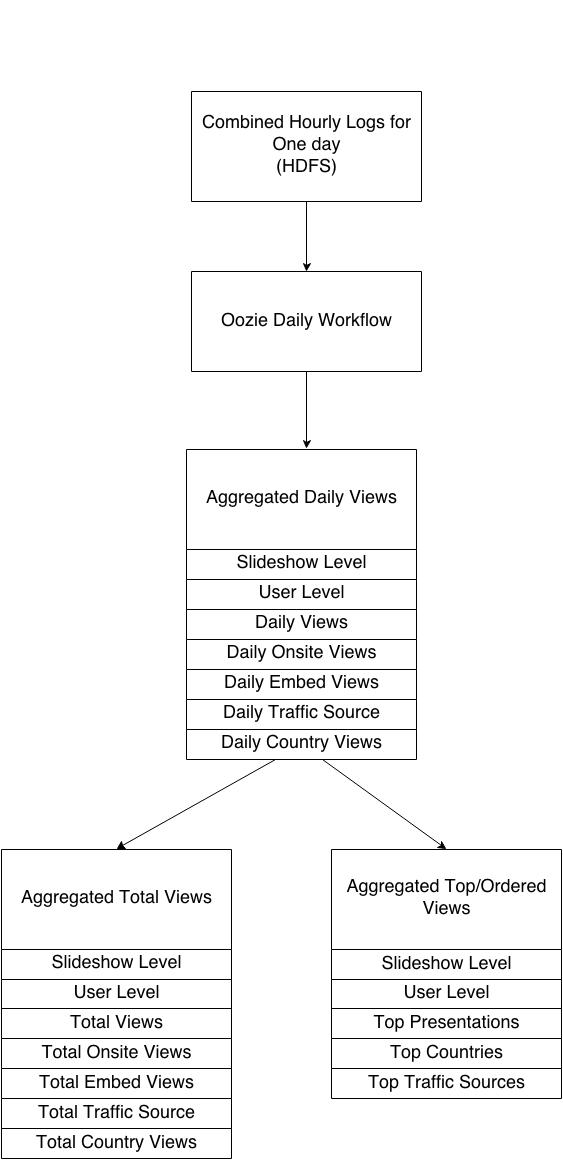
Fig 3: Daily Data Processing Pipeline
- Daily workflow starts at 5 minutes past midnight every day
- All data points are computed at user and slideshow level
- Daily workflow completes generally in 4-5 hours
- For top and total tables we store data for 3 consecutive days
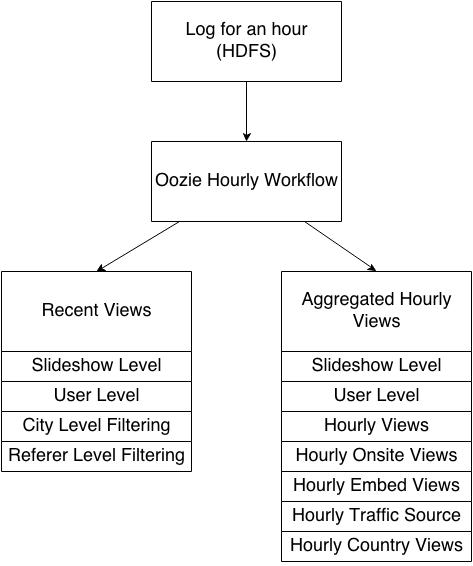
Fig 4: Hourly Data Processing Pipeline
- Hourly workflow runs 24 times a day and starts after 5 mins of preceding hour
- Hourly workflow completes in 10-20 mins.
Overview of Hadoop Infra
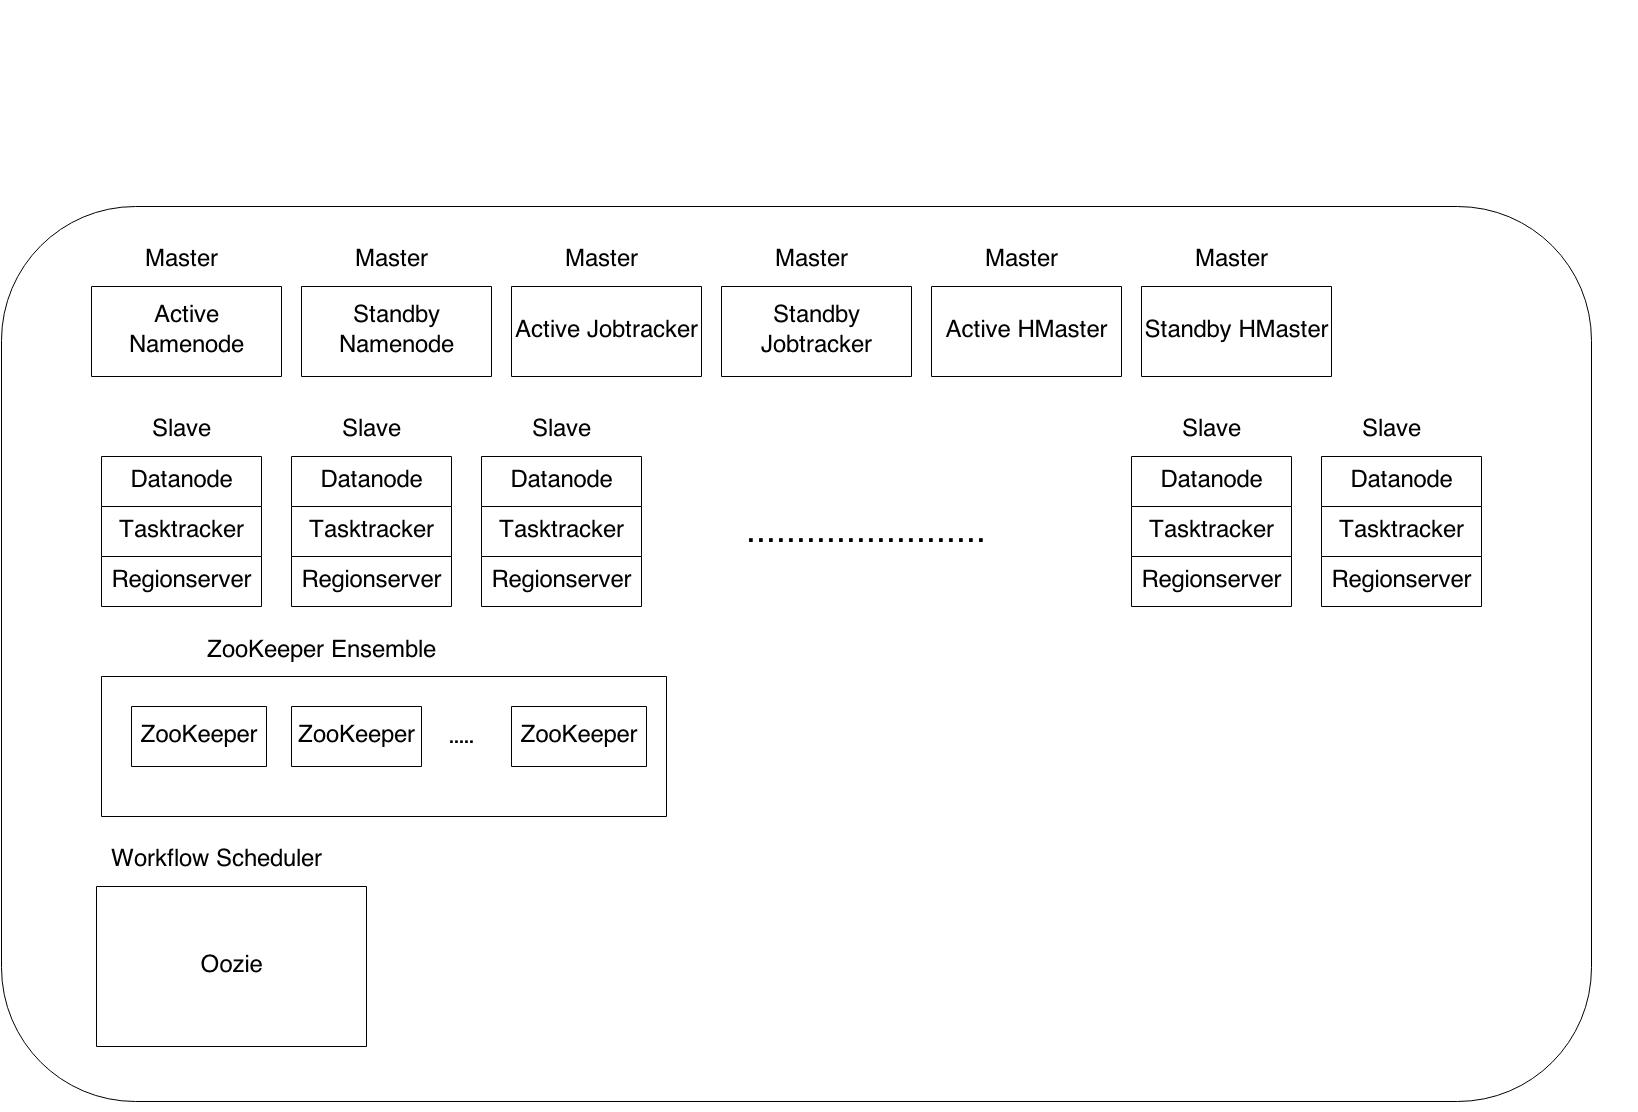
Fig 5: Overview of Hadoop/HBase Cluster at SlideShare
- We have a highly available setup for masters which means that there is no SPOF
- Datanode, Tasktracker and Regionserver run on same node
- We currently have 6 master nodes and 25 slave nodes
- Oozie is running on one of the namenodes
- ZooKeeper [15] ensemble is hosted on multiple master nodes
HA Setup for Hadoop/HBase Masters
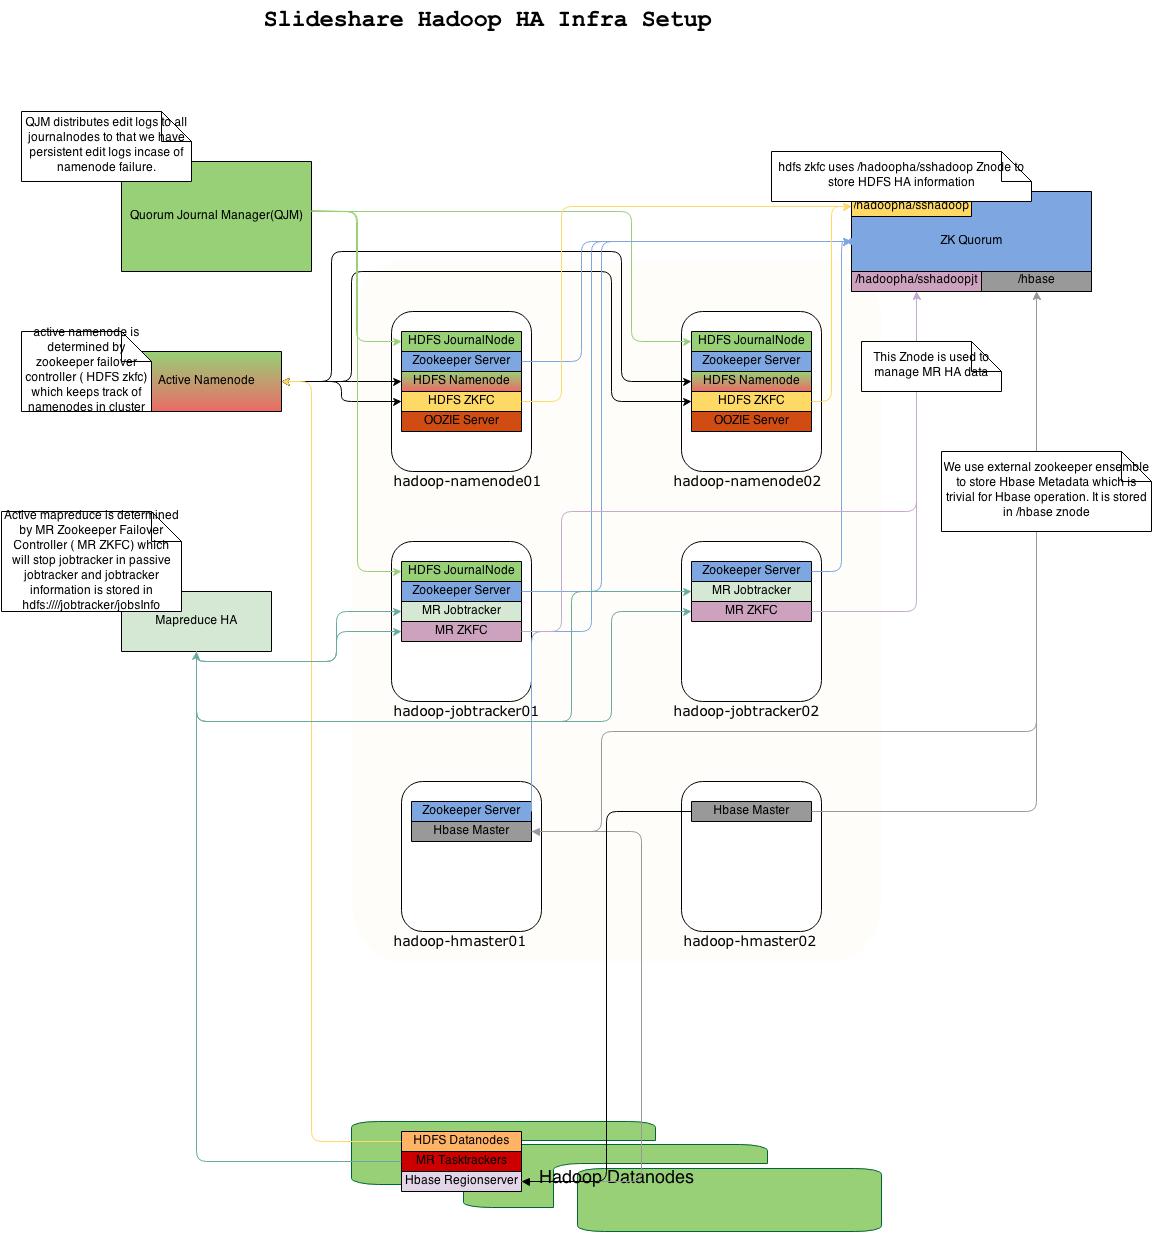
Fig 6: SlideShare Hadoop/HBase HA setup for masters
Since we rely on Hadoop/HBase for storing analytics data, it’s quite critical to the infrastructure and hence we have a complete HA setup [16]:
1. Active-standby namenode setup: In the event of namenode failure, a hot standby takes over as active.
- JournalNodes : Daemons synchronize EDITs across namenodes so that standby namenodes are always updated and ensure HOT standby state.
- HDFS ZKFC: Daemons track the namenode status and trigger a failover in an event of namenode failure. This relies on ZooKeeper cluster.
- ZooKeeper Quorum: a cluster of hosts that synchronize information and store the state of namenode.
2. Active-standby Jobtracker setup: In the event of JobTracker failure, the failover standby server takes over and handles running JobTracker information.
- JobTracker HA Daemons: JobTracker hosts have JobTracker HA daemon running on them.
- JobTracker ZKFC: Daemon triggers failover in an event of JobTracker failure
- HDFS Jobtracker Information: The place where we store jobtracker information in HDFS so that it can be used in event of failure.
3. Active-Backup HBase Masters setup: Two HBase masters will be running with one running as master and another as backup master.
Configuration/Optimization Work
Hadoop ecosystem is highly configurable [17] which is good but can be very frustrating [18] at times in a fast moving ecosystem. There is a sea of configuration parameters and it’s a big challenge to understand these params. Moreover, values for many of these parameters depend on your use case and a lot of them have to actually be tried in production to see what value works best for you.
Strategy that we follow:
1. Understand the config parameter
2. Look out for recommended values on web and books
3. Discuss with colleagues whether it’s good for our use case
4. Change one parameter at a time and monitor its effect
5. Negative impact - revert
6. Positive impact - joy!
Hadoop:
1. dfs.blocksize: Increased HDFS block size to 128 MB [19] [23]
2. mapred.child.java.opts: (Default: -Xmx200m, Using: -Xmx800m) [19] [23]
We override global value with 1 GB in most Pig scripts.
3. io.sort.mb: The total amount of buffer memory to use while sorting files, in megabytes.
(Default: 100, Using: 200) [19] We override it in many Pig scripts by using 512MB because of significant amount of spilled records. [23]
4. mapred.output.compression.type: If the job outputs are to be written as SequenceFiles, this parameter specifies compression type to use. (Default: RECORD, Using: BLOCK) [20] [21] [23]
5. mapred.output.compression.codec and mapred.map.output.compression.codec: (Default: org.apache.hadoop.io.compress.DefaultCodec, Using: org.apache.hadoop.io.compress.SnappyCodec) [20] [21] [23]
6. mapred.compress.map.output: (Default: false, Using: true) [21] [23]
7. mapred.tasktracker.map.tasks.maximum and mapred.tasktracker.reduce.tasks.maximum: Depends on RAM, CPU, other services running on node, types of typical jobs being run on the cluster. We’re using 7 and 4 respectively. [22] [23]
8. io.file.buffer.size: Determines how much data should be buffered during read/write operations.
(Default: 4096, Using: 131072) [23]
9. mapred.jobtracker.taskScheduler: We’re in the process of fine tuning FairScheduler config parameters. It’ll become very important once we start supporting a number of products,
adhoc analysis, and data processing pipelines.
Default: org.apache.hadoop.mapred.JobQueueTaskScheduler
Using: org.apache.hadoop.mapred.FairScheduler
10. io.sort.factor: The number of streams to merge at once while sorting files. [23]
Default: 10
Using: 50
11. mapred.reduce.tasks: We override at Job level (Pig scripts). [23]
Default: 1
12. tasktracker.http.threads: The number of worker threads for the http server. This is used for map output fetching. [23]
Default: 40
Using: 80
HBase: [37]
1. HBASE_HEAPSIZE: The maximum amount of heap to use, in MB. (Default: 1000, Using: 10000) [22] [24]
2. JVM GC Tuning: Our JVM GC parameters are based on the guidelines mentioned in [25]
3. hbase.regionserver.global.memstore.upperLimit and hbase.regionserver.global.memstore.lowerLimit: Using Default
4. hbase.regionserver.handler.count: Default: 10, Using: 20
5. Bulk Loading: We use bulk load API [8] of HBase to process HAProxy logs in the first stage of data processing pipeline. Bulk load bypasses write path, is very fast and decreases the load on cluster. [26] [27]
6. Snappy Compression: We have enabled snappy compression for all tables. It saved us about 5-10x storage space.
7. Future work/Work in Progress: [28]
(Mostly related with read performance)
- Changing Prefix compression to FAST_DIFF
- Reducing HBase block size
- More block cache
- Short circuit local reads
- Row level bloom filters
1. hbase.client.scanner.caching: HBase param set from Pig script. Number of rows that will be fetched when calling next on a scanner if it is not served from (local, client) memory. Higher caching values will enable faster scanners but will eat up more memory.
Using: 10000.
2. hbase.client.write.buffer: HBase param in bytes set from Pig script. A bigger buffer takes more memory — on the client and server side since server instantiates the passed write buffer to process it — but a larger buffer size reduces the number of RPCs made.
Default: 2097152
Using: 10000000
3. default_parallel: Sets the number of reducers at the script level. Using: 20/30
4. pig.cachedbag.memusage: Sets the amount of memory allocated to bags.
Default: 0.2 (20% of available memory)
Using: 0.7 for some Pig scripts
5. pig.exec.mapPartAgg: Improves the speed of group-by operations.
Migrating Old Analytics to Hadoop/HBase
Since this was a one-off exercise, instead of building an ETL pipeline, we manually dumped all the MySQL tables of interest into HDFS and wrote some Pig scripts to transform the data and stored it into HBase. In some cases, there were one to many relationships between the MySQL and HBase tables. In those cases, we wrote some extra tests just in case to make sure that there were no data discrepancies between the sources.
And then there was the question of dealing with data points which were not available in the old system and some which we started collecting only recently, like outbound clicks. Since back processing old logs was not an option, we maintain a list of the date of “inception” of all data points. Additionally, we’ve written the web app in such a way that the numbers gray out and warn you in case the date range that you had requested for was not available for this particular datapoint.
TreeBeard - The Aggregation Layer
At the aggregation layer, we calculate dynamic range based on hourly and daily workflow update tables. These two tables give us information about the completion of last run hourly and daily processing pipeline.
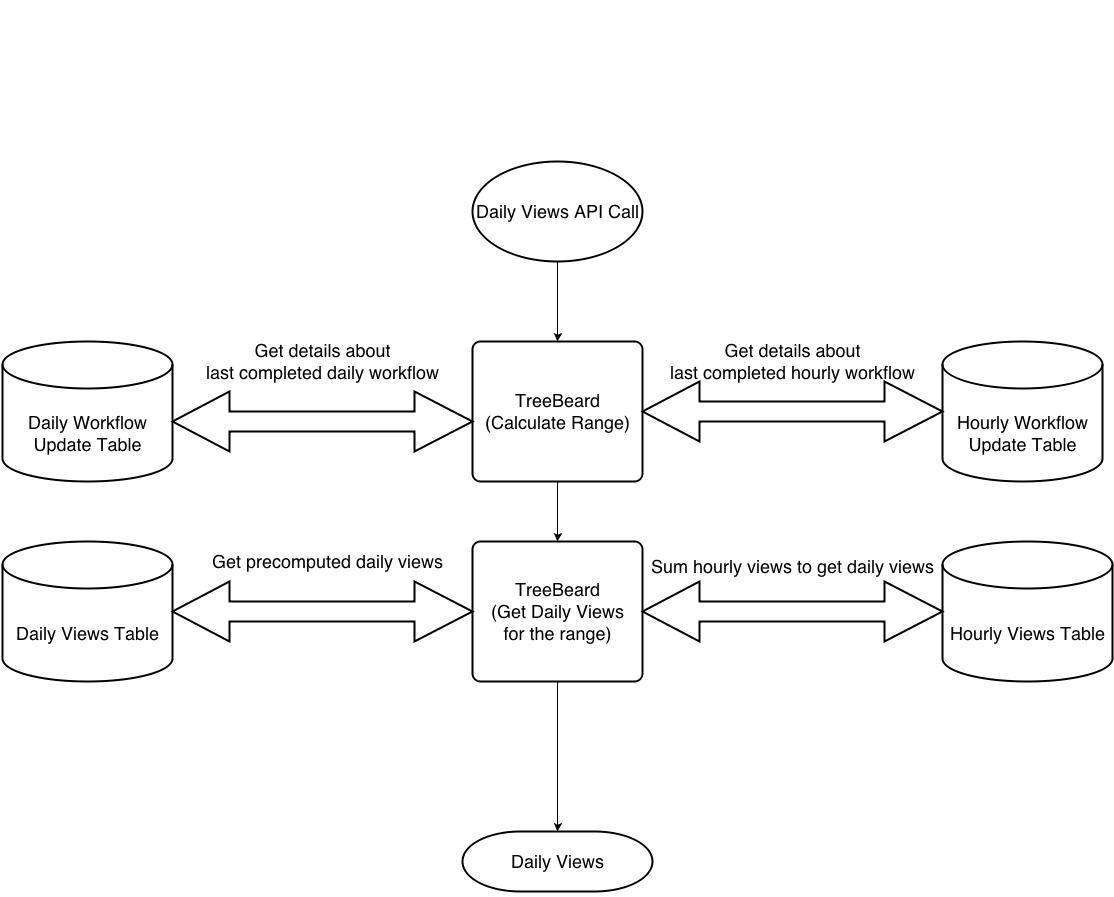
Fig 7: TreeBeard API - Near Realtime Aggregation Layer [Daily Views]
Range will have some dates for which we can't get precomputed aggregated daily views from daily processing pipeline. For these dates we use hourly tables which are updated every hour. We query hourly table and sum the views on the fly at query time.
Explanation with an Example:
We'll explain the aggregation logic with an example.
Consider server time of Apr 3, 2014 03:00 hrs. At this point of time daily processing for Apr 1 is complete and daily processing for Apr 2 is underway, having started at Apr 3, 00:05 hrs. We'll also have 2 hours of hourly views available.
Range for showing 1 month of daily views will be Mar 4 to Apr 3. For Mar 4 to Apr 1, we'll use precomputed daily views from daily processing pipeline. For Apr 2 and Apr 3, we'll use summation of hourly views.
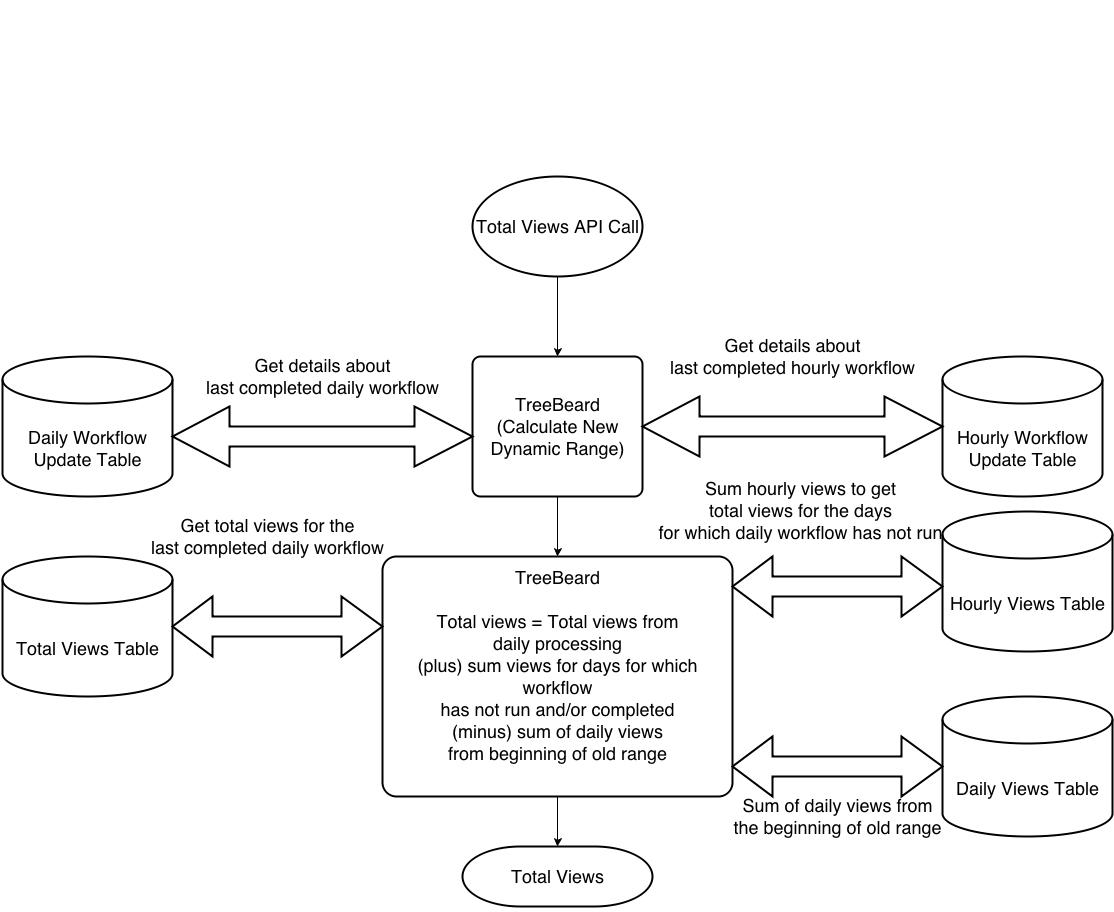
Fig 8: TreeBeard API - Near Realtime Aggregation Layer [Total Views]
The new dynamic range will have an overlap with date range for which daily processing for total views is complete. For computing new total views we'll have to add views for the days for which daily processing is not complete and deduct views from the starting of range for precomputed total views obtained from daily processing pipeline.
Explanation with an Example:
We'll explain the aggregation logic with an example.
Consider server time of Apr 3, 2014 03:00 hrs. At this point of time daily processing for Apr 1 is complete and daily processing for Apr 2 is underway, having started at Apr 3, 00:05 hrs. We'll also have 2 hours of hourly views available.
Range for showing 1 month of total views will be Mar 4 to Apr 3. Most recent precomputed total views from daily processing pipeline is for the range Mar 2 to Apr 1.
Total views (Mar 4 to Apr 3) = Total views from daily data processing pipeline (Mar 2 to Apr 1) + Total views for Apr 2 and Apr 3 obtained by summing hourly views - Total views for Mar 2 and Mar 3 obtained by summing daily views
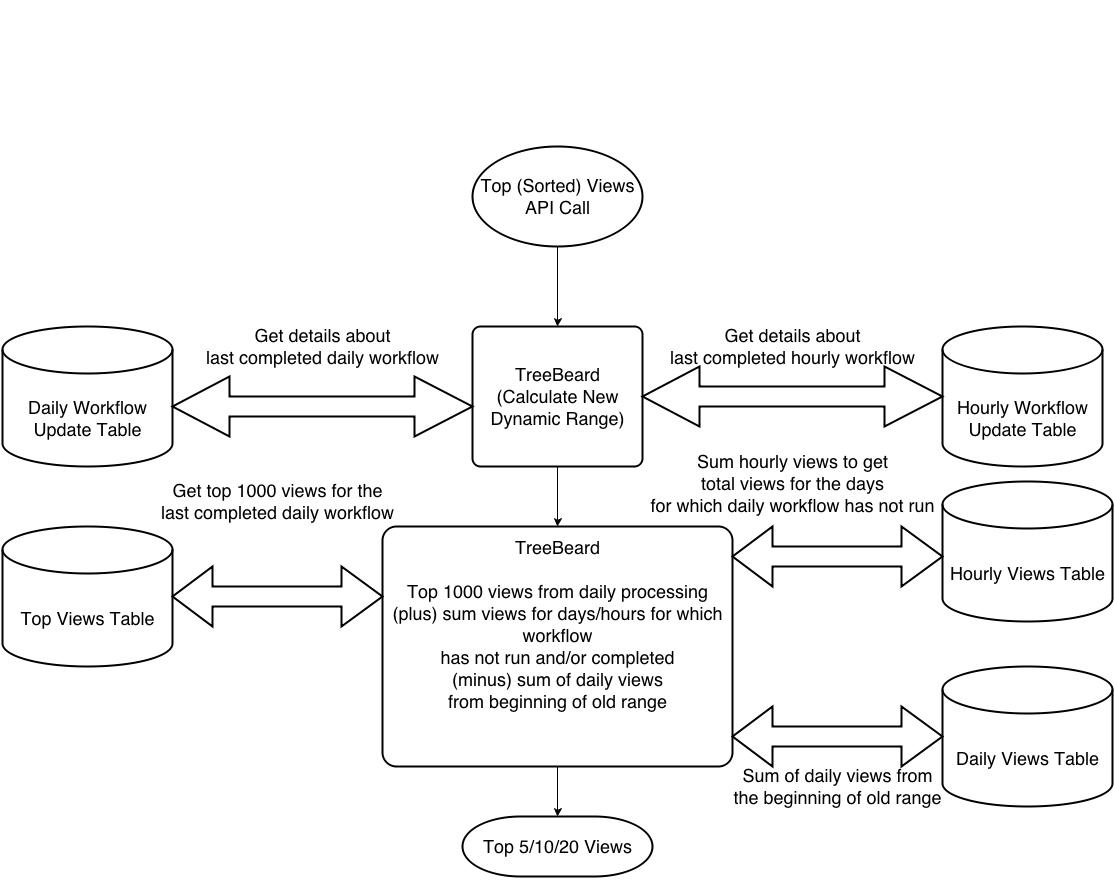
Fig 9: TreeBeard API - Near Realtime Aggregation Layer [Top Views]
The new dynamic range will have an overlap with date range for which daily processing for top views is complete. For computing new top views we take a practical approach of getting top 1000 views from daily processing pipeline and adding delta hits to all these views. Then we sort in memory and return top 5/10/20 views.
Explanation with an Example:
We'll explain the aggregation logic with an example.
Consider server time of Apr 3, 2014 03:00 hrs. At this point of time daily processing for Apr 1 is complete and daily processing for Apr 2 is underway, having started at Apr 3, 00:05 hrs. We'll also have 2 hours of hourly views available.
Range for showing 1 month of top views will be Mar 4 to Apr 3. Most recent pre-computed and sorted top views from daily processing pipeline is for the range Mar 2 to Apr 1.
Top views for Mar 4 to Apr 3 is calculated as follows -
Step 1: Top 1000 views for Mar 2 to Apr 1
Step 2: Add total views for Apr 2 and Apr 3 obtained by summing hourly views to each of the sorted hits count
Step 3: Deduct total views for Mar 2 and Mar 3 obtained by summing daily views from each of the sorted hits count
Step 4: In memory sorting
Step 5: Return top 5/10/20
Testing (Analytics Data Points)
1. Reconciliation Test verifying the integrity between various pages
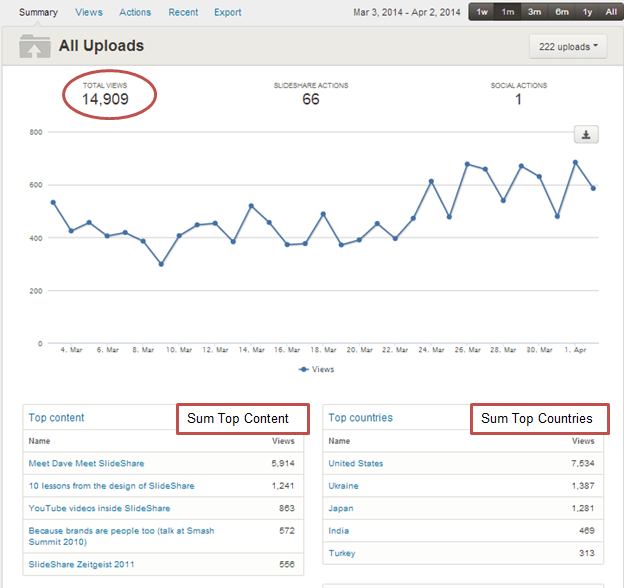
Fig 10: Summary Tab
- Checking for each of top 5 content Views <= Total views
- Checking for each of top 5 country Views <= Total views
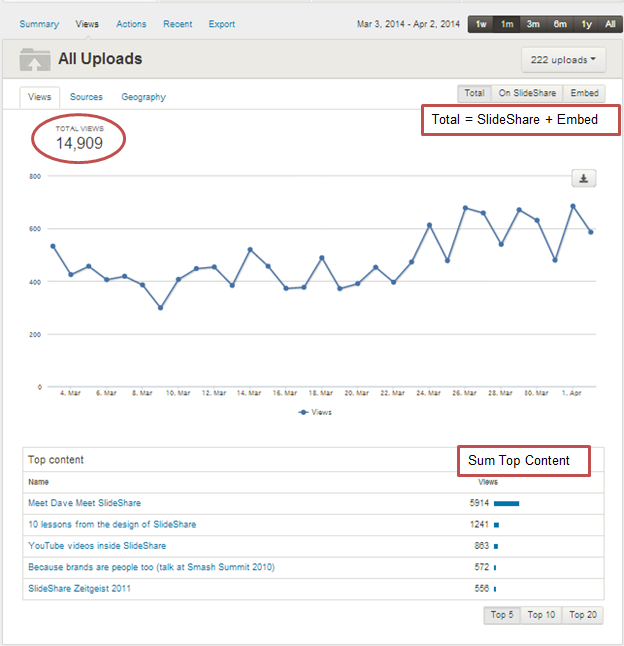
Fig 11: Views Tab
- Total views = SlideShare + Embeds
- Each of top (5/10/20) <= Total views
- Sum of top content views <= Total views
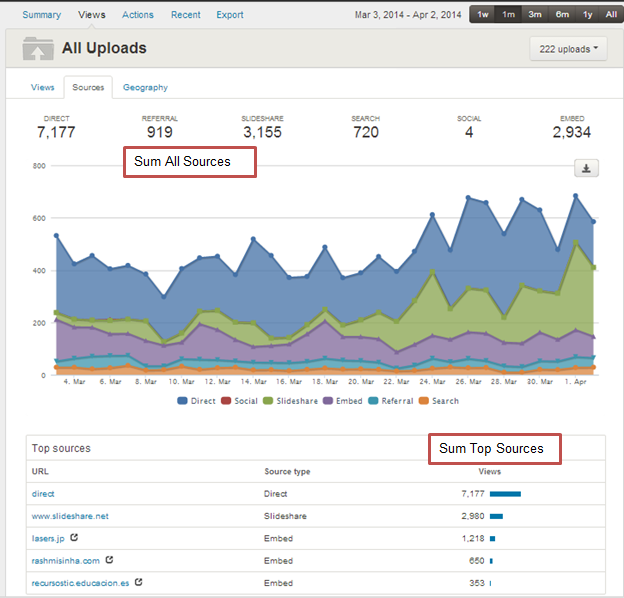
Fig 12: Sources Tab
- Total views = Sum of all sources
- Total views count >= Each of source count
- Each of top sources (5/10/20) <= Total views
- Sum of top sources <= Total views
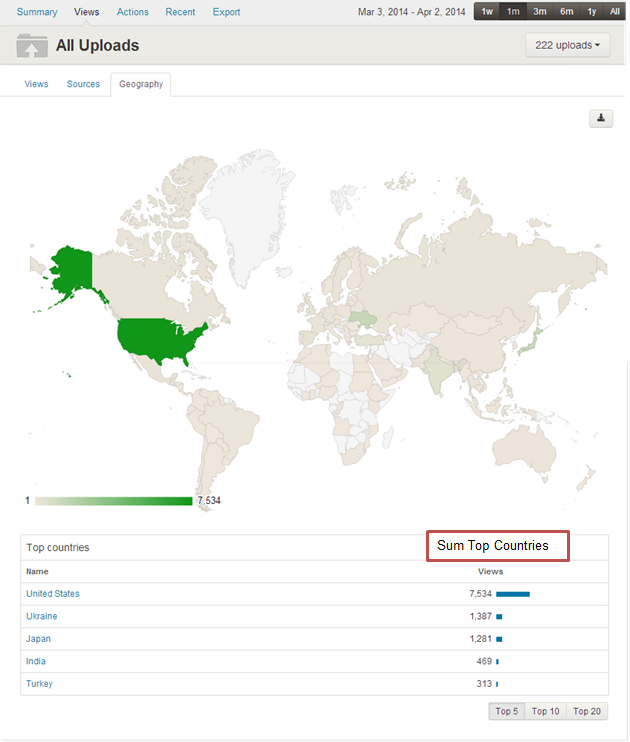
Fig 13: Geo Tab
- Each of top country (5/10/20) <= Total views
- Sum of top countries <= Total views
2. Data consistency amongst various Treebeard API calls (realtime = true)
| Data Type | Data For | Trend | Realtime | Range | Additional Params |
| Views | User | hourly | true | 1w | source |
| Traffic Sources | Slideshow | daily | false | 1m | date |
| Country | total | 3m | limit | ||
| Referer Views | top | 6m | country | ||
| all | user_id | ||||
| referer | |||||
| referer_source |
Use Cases
- User and slideshow level
- All 5 types of uploads (Presentation, documents, infographics, videos, and slidecasts)
- Low, mid and high usage users
- 1w, 1m, 3m, 6m and all time ranges
- Hours when daily processing finishes
Test Cases
- Total views = Total views (embed) + Total views (onsite)
- Total views = Total traffic sources
- Total views >= Total country views
- Total views = Sum daily views
- Total views >= Sum top content
- Total views >= Sum top traffic sources
- Total country views = Sum daily country views
- Total traffic source = Sum daily traffic source
- Total referer views = Sum daily referer views
- Top traffic sources <= Total referer views
- Daily views >= Sum hourly views (0-5% error)
- Daily country views >= Sum hourly country views (0-5% error)
- Daily traffic source >= Sum hourly traffic source (0-5% error)
- Total views (Slideshow) = Views on Top content
- Limits are working (max being 1000)
- New user/uploads/country processed in hourly data processing pipeline
What We Learnt
- HBase schema design is critical to latency as well as data that is scanned while running MR jobs.
- Number of regions map to number of tasks that are created while running MR jobs over HBase tables. Because of oversight and/or poor understanding at one point of time we were stuck with 24+ hours of processing for daily workflow. [38] [39] Pre split regions if required. HBase 0.94 improved the default region split policy and is much better. [31] [32]
- We had written a UDF that used to add up the views for a given range. It caused increased memory requirement for task and because of that regionservers used to die regularly with OOM error. Finally, we removed custom UDF with in built SUM and GROUP BY operations with much less memory requirement at the cost of increased processing time because of spilled records.
- Always change configuration parameter one at a time, otherwise you may not be able to measure the impact.
Limitations
- HBase schema design is very tightly coupled with query patterns. Slight change in query requirement can make you to create a new table (and potentially reprocess a lot of data again)
- Pig script debugging is hard.
- Top lists can incorporate new entries only in daily processing, not in hourly.
- Hourly data stored only for past 10 days.
- Top views can show a maximum of 1000 entries.
- Latest views limited to 1000 entries.
- Some time is spent in recovering from/repairing failed HBase components [33]
- Currently we have one monolithic cluster, which is supporting multiple use cases. [34]
Looking Forward
- Support more products on the cluster
- Reduce the entry barrier for non-Hadoop and non-tech guys. Spend time on setting up and increasing the adoption of Hue [35]
- CDH5 upgrade [36]
Blog Post Contributors and Team Members
- Akshit Khurana
- Amit Sawhney
- Anil Siwach
- Ankita Gupta
- Bubby Rayber
- Diksha Kuhar
- Hari Prasanna
- Jasmeet Singh
- Nikhil Chandna
- Nikhil Prabhakar
- Prashant Verma
References
1. PRO Analytics Are Now Faster, Simpler, Better
2. CDH: 100% Open Source Distribution including Apache Hadoop
- Apache HBase [hbase-0.94.6-cdh4.3.0]
- Transcript of HBase for Architects Presentation
- Tutorial: HBase (Theory and Practice of a Distributed Data Store) [pdf]
- HBase Architecture 101 - Storage
- HBase Architecture 101 - Write-ahead-Log
- HBase and HDFS: Understanding FileSystem Usage in HBase
- Pig Documentation [pig-0.11.0-cdh4.3.0]
- Pig Mix - PigMix is a set of queries used test pig performance from release to release
- HBaseStorage - HBase implementation of LoadFunc and StoreFunc
6. Chapter 10. Writing Evaluation and Filter Functions [Programming Pig by Alan Gates]
7. Apache Oozie Workflow Scheduler for Hadoop
- Oozie, Workflow Engine for Apache Hadoop [oozie-3.3.2-cdh4.3.0]
- Apache Oozie Client 3.3.2-cdh4.3.0 API
- How-To: Schedule Recurring Hadoop Jobs with Apache Oozie
8. Tool to load the output of HFileOutputFormat into an existing table [API]
- File format for hbase. A file of sorted key/value pairs. [API]
11. TorqueBox 2.x Performance Benchmarks
12. JRuby: The Ruby Programming Language on the JVM
13. Apache Phoenix: "We put the SQL back in NoSQL"
- Phoenix in 15 minutes or less
14. Fluentd: Open Source Log Management
- HDFS (WebHDFS) Output Plugin
15. Apache ZooKeeper
16. CDH4 High Availability Guide
17. Configuring/Optimizing Hadoop ecosystem
- Hadoop
- core-default.xml
- hdfs-default.xml
- mapred-default.xml
- Deprecated Properties
- Ports Used by Components of CDH4
- HBase
- 2.3. Configuration Files [The Apache HBase™ Reference Guide - Latest]
- hbase-default.xml [0.94.6]
- HConstants.java [0.94.6]
- Constant Field Values [hbase-0.94.6-cdh4.3.0]
- What are some tips for configuring HBase?
- Guide to Using Apache HBase Ports
- HBaseConfTool
- Pig
- Oozie
18. https://twitter.com/_nipra/status/364662881708544000
19. Tuning DSE Hadoop MapReduce
20. Using Snappy for MapReduce Compression
21. Chapter 7: Tuning a Hadoop Cluster for Best Performance
(Using compression for input and output)
[Hadoop Operations and Cluster Management Cookbook]
22. 8.10. Recommended Memory Configurations for the MapReduce Service
23. Chapter 5. Installation and Configuration
(MapReduce - Optimization and Tuning / HDFS - Optimization and Tuning)
[Hadoop Operations]
24. HBase Administration, Performance Tuning
- Avoiding Full GCs in Apache HBase with MemStore-Local Allocation Buffers: Part 1
- Avoiding Full GCs in HBase with MemStore-Local Allocation Buffers: Part 2
- Avoiding Full GCs in Apache HBase with MemStore-Local Allocation Buffers: Part 3
- 12.3.1. The Garbage Collector and Apache HBaseChapter 11. Performance Tuning / Garbage Collection Tuning (HBase - The Definitive Guide)
26. How-to: Use HBase Bulk Loading, and Why
29. Performance and Efficiency [Pig]
31. HBASE-4365 - Add a decent heuristic for region size
32. RegionSplitPolicy [API]
- ConstantSizeRegionSplitPolicy [Default split policy before 0.94.0]
- IncreasingToUpperBoundRegionSplitPolicy [Default split policy since 0.94.0]
33. HBase: How to get MTTR below 1 minute
34. Hadoop Hardware @Twitter: Size does matter! [Video] [Slideshow]
35. Hue
- Chapter 12. Apache HBase Performance Tuning (The Apache HBase™ Reference Guide - Latest)
- Chapter 11. Performance Tuning (HBase - The Definitive Guide)
38. 7.1. Map-Task Splitting (The Apache HBase™ Reference Guide – Latest)
39. HBase as MapReduce job data source and sink
Other Resources
- Hadoop: The Definitive Guide, 3rd Edition
- Hadoop Operations and Cluster Management Cookbook
- Optimizing Hadoop for MapReduce
- HBase Administration Cookbook
- Cloudera Developer Blog · HBase Posts
- From the Dev Team [Hortonworks Blog]
- Deploying with JRuby: Deliver Scalable Web Apps using the JVM
- Using JRuby: Bringing Ruby to Java
- TorqueBox 3.0.0 Documentation
- hbase-jruby: a simple JRuby binding for HBase
- … and some fun Harlem Shake at SlideShare Delhi