Geographic trends in skills using LinkedIn's Endorsement feature
August 6, 2013
LinkedIn’s Endorsements feature has been growing rapidly; in less than six months, LinkedIn members have generated over two billion endorsements. I have been spending part of my internship at LinkedIn exploring this data. In this post, I’ll discuss how I was able to use word clouds to reveal skill trends in specific geographic areas, including a surprising result in Silicon Valley.
Tag clouds
First, I wanted to understand how various technology hubs in the United States compare with each other. For example, are there any differences in skills and expertise between technology professionals in California and New York?
I started with a tag cloud:
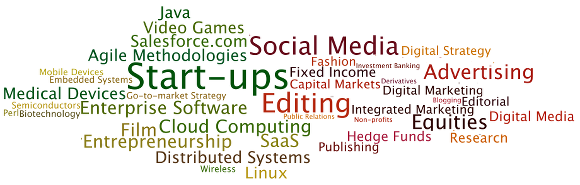
The difference is fairly obvious. We see that startups, SaaS, distributed systems, film (think Los Angeles), wireless, and biotechnology are prominent in California. In New York, with its considerable financial sector, we find expertise in equities, hedge funds, and capital markets. We also see media-related skill sets such as advertising, publishing, social media, and digital strategy dominating in New York.
Next, let's see how Seattle and Boston compare:

In Seattle, the widespread influence of Microsoft accounts for agile methodologies, C#, UX, and video games; Amazon’s presence explains the dominance of skills such as cloud computing, distributed systems, and e-commerce. In Boston, research and higher education in the fields of life science, pharmaceuticals, and molecular biology trend higher, and the significant impact of law and business firms explains the trends in management consulting, financial modeling, legal research, and litigation.
Data Analysis and Workflow
Here is how I created these word clouds:
- Take each member's geographic location and associate it with prominent skills in that area.
- To deal with popular skills like Java or Microsoft Office, which would be commonly present in all regions, I used a variation of the TF-IDF algorithm. I considered geographic regions as documents and a max normalized endorsement count as the term frequency.
- I introduced the skill and its normalized weight in that region into Wordle to generate the tag cloud images.
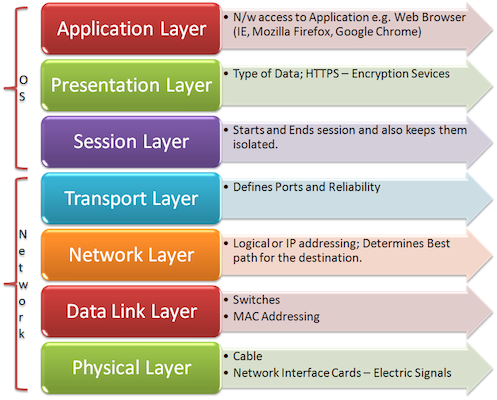
Are Bay Area technology companies situated like the OSI model?
On one of our weekly happy hours, my internship mentor jokingly suggested that technology companies in the Bay Area are situated geographically like the OSI model: the physical layer is in San Jose, the application layer in San Francisco, and the rest in between. I was curious to find out if this was true.
I took all employees of technology companies located in the Bay Area and used the company location as the employee's geographic coordinates to deal with cases where employees live and work in different locations. For example, someone lives in San Francisco but works in San Jose; in this case, we want to attribute that person's skills to San Jose. Then, we used the aggregate skills of all employees in each company to form a representation of the skill domain at the company.
I used this approach to generate tag clouds for four cities in the Bay Area. The result is the Bay Area OSI Model:
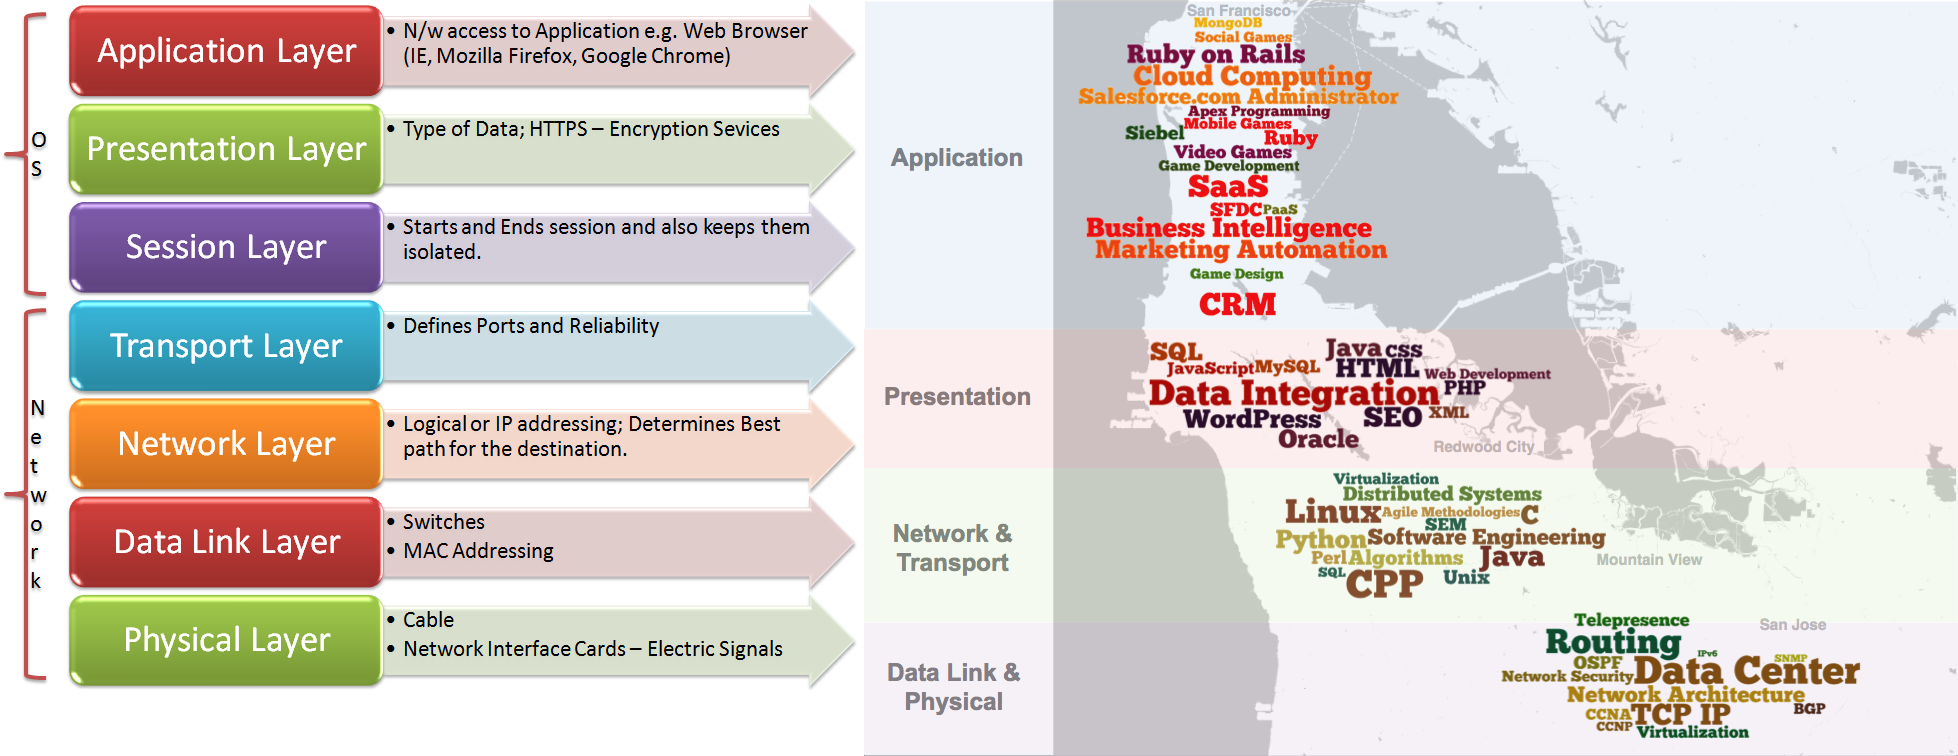
- In San Francisco, we find client-facing applications such as CRM, Salesforce, and marketing automation, with relevant technologies such as cloud computing, SaaS, Ruby on Rails, and MongoDB.
- As we move south towards Redwood City, skills become presentation-oriented; prominent ones are data integration, WordPress, Java, CSS, and HTML.
- Mountain View is dominated by software systems and programming languages-based skills including distributed computing, Linux, Java, C, and algorithms.
- Finally, around Sunnyvale and further south, we see data-centric, computer networking-related skills ranging from network architecture and TCP/IP to data centers and virtualization.
We have barely begun to scratch the surface in analyzing Skills and Endorsement’s data. Stay tuned for more posts!